This article was written exclusively for Investing.com
- Copper is the leader among nonferrous metals
- PICK holds the leading companies that produce metals and minerals
- If 2008-2011 is a model, PICK has lots of upside potential
The base metals sector of the commodities market contains those materials that trade on the London Metal Exchange. The LME offers forward-like contracts for copper, aluminum, nickel, lead, zinc and tin.
Forwards allow for more flexibility compared with futures, since consumers and producers can take or make delivery on any business day both parties agree on. In the futures markets, delivery on a contract can only occur during the pre-set delivery period. The leading market participants in the world of base metals are producers and consumers. They tend to flock to the LME which better meets their hedging requirements.
The six metals are critical inputs when it comes to building infrastructure around the world. While all countries worldwide consume these metals, and demand might significantly increase if the Trump administratrion's $1 trillion infrastructure proposal ever gains traction, currently, China is by far the most influential factor. The world’s most populous nation has had a growing demand for nonferrous metals over the past decades.
Extracting metals from the crust of the earth is a capital-intensive business. There are many metals and minerals producers in the world. The iShares MSCI Global Metals & Mining Producers ETF (NYSE:PICK) holds shares of the leading producers of nonferrous metals in a diversified portfolio.
Copper: leader among nonferrous metals
Doctor Copper is a commodity that can offer a good diagnosis of the overall health and wellbeing of global economic conditions.

Source all technical charts: CQG
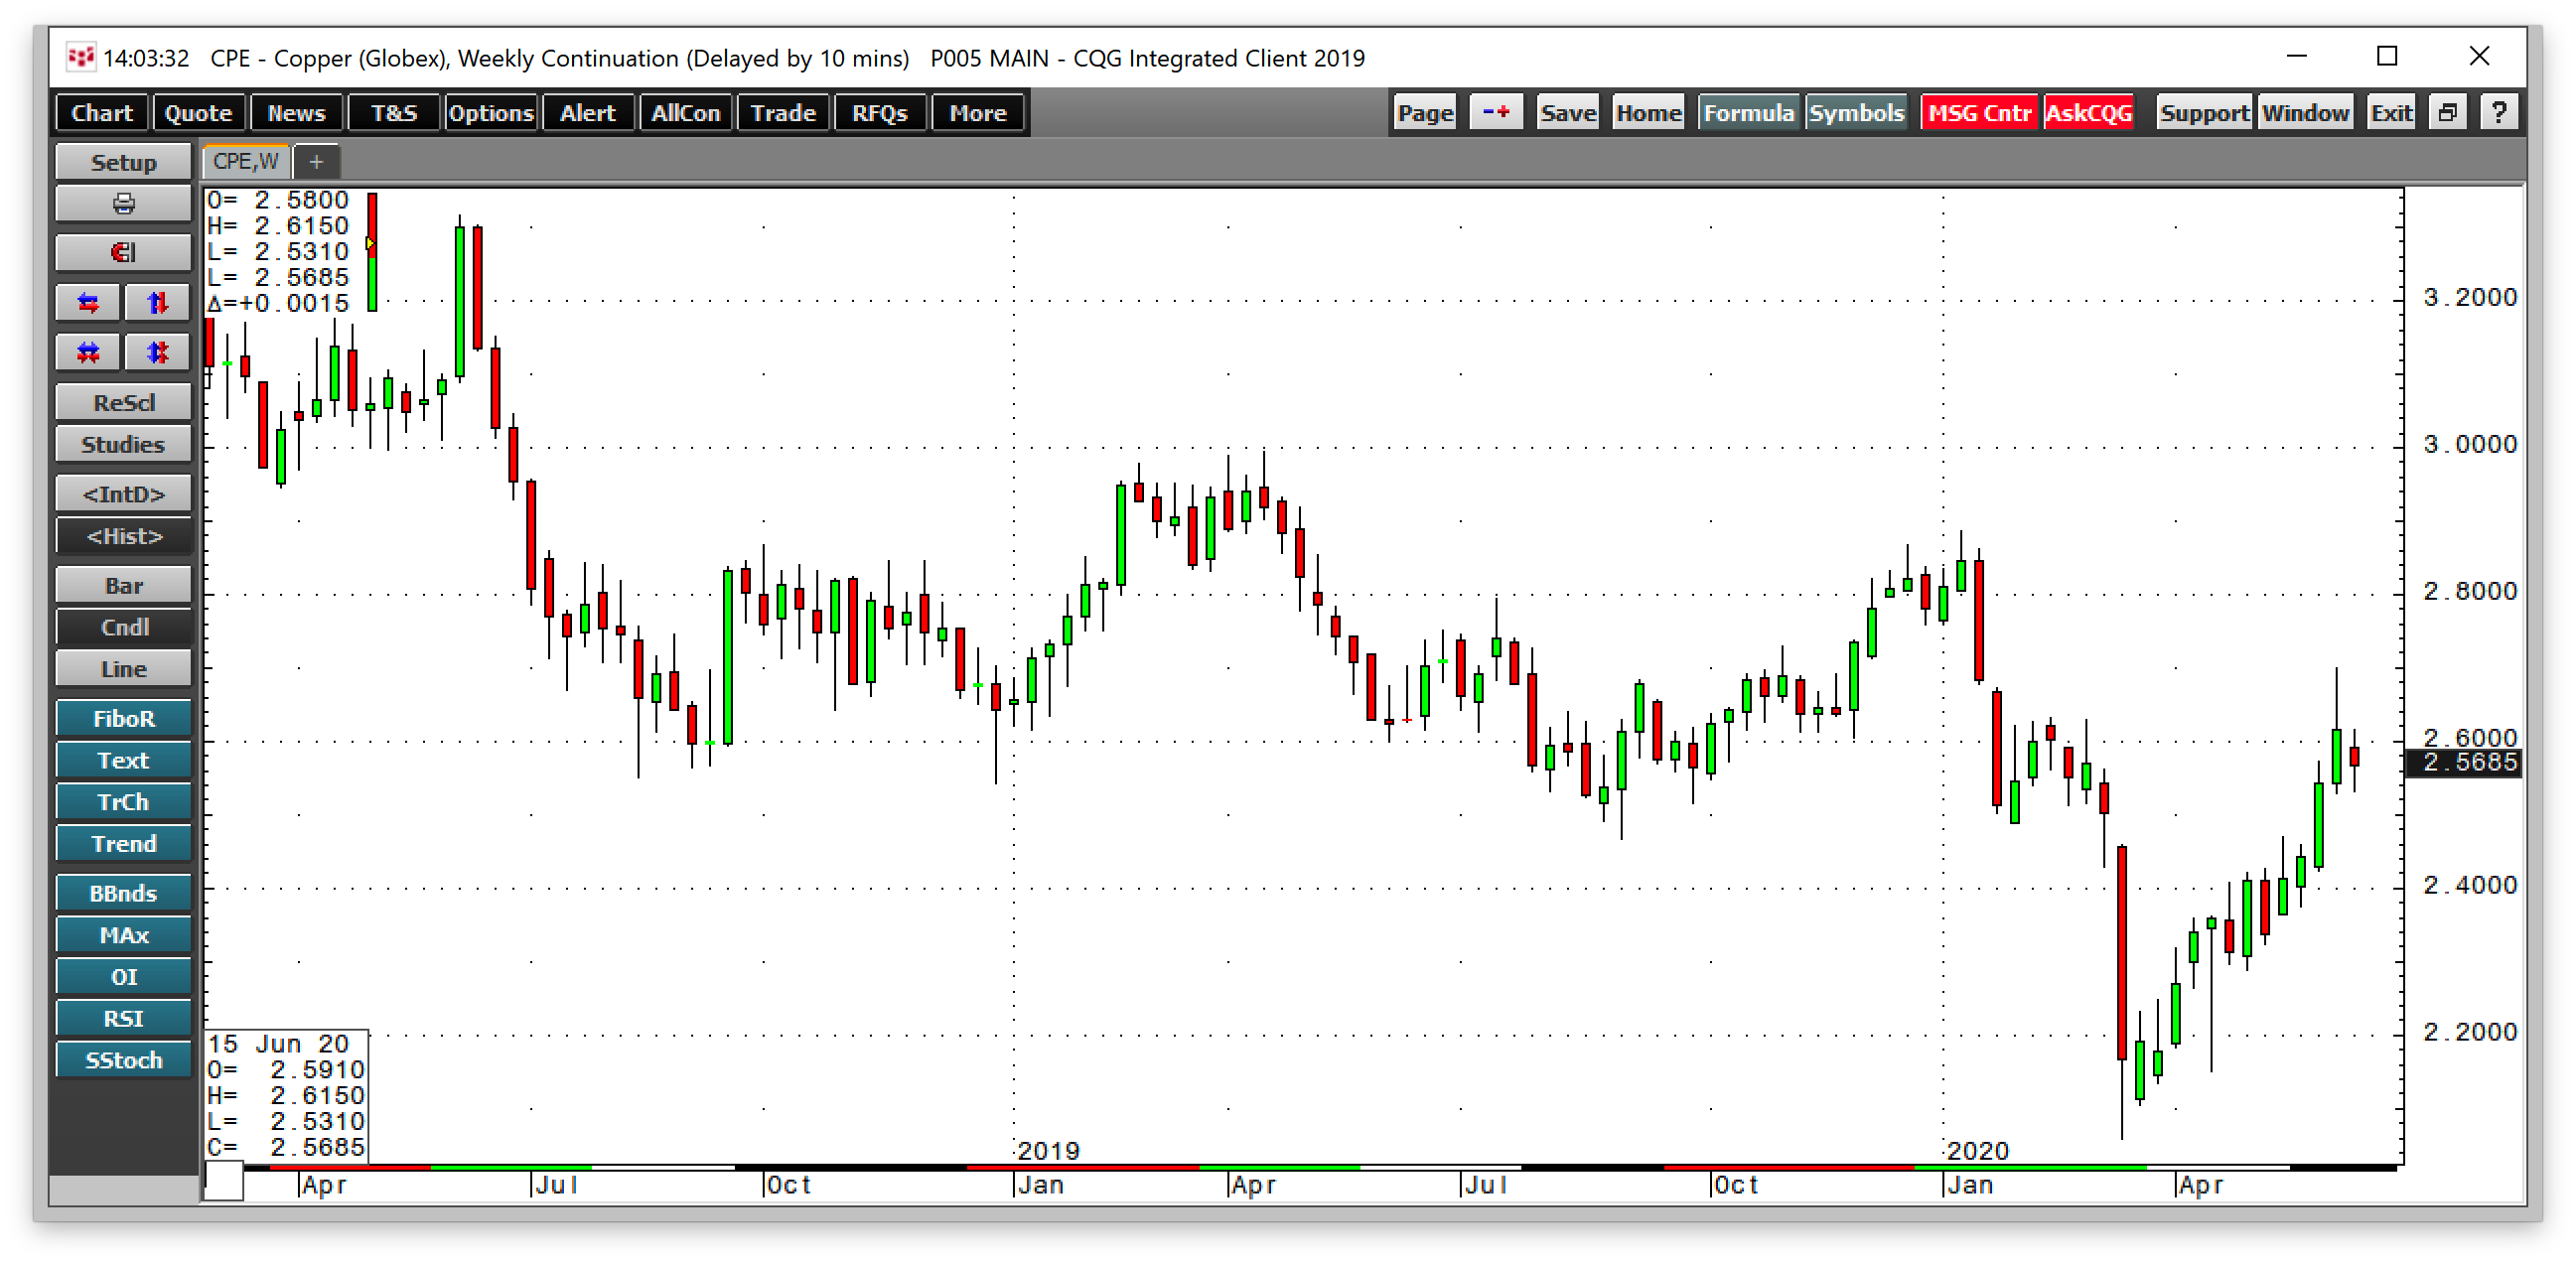
The weekly chart highlights the red metal's decline from a high of $2.8860 per pound in mid-January when optimism over the Phase 1 trade deal between the US and China peaked. Coronavirus took copper to a low of $2.0595 in mid-March when the stock market hit its own low during the risk-off period. The March bottom was the lowest price since mid-2016.
The midpoint for the price of nearby copper futures in 2020 stands at $2.4730 per pound. Over the past three months, the nonferrous metal recovered, reaching a high of $2.70 on June 10. At just below the $2.57 level on June 16, copper was sitting comfortably above its midpoint for this year.
Copper often leads the other nonferrous metals listed above, when it comes to the path of least resistance for prices.
PICK holds the leading companies that produce metals and minerals
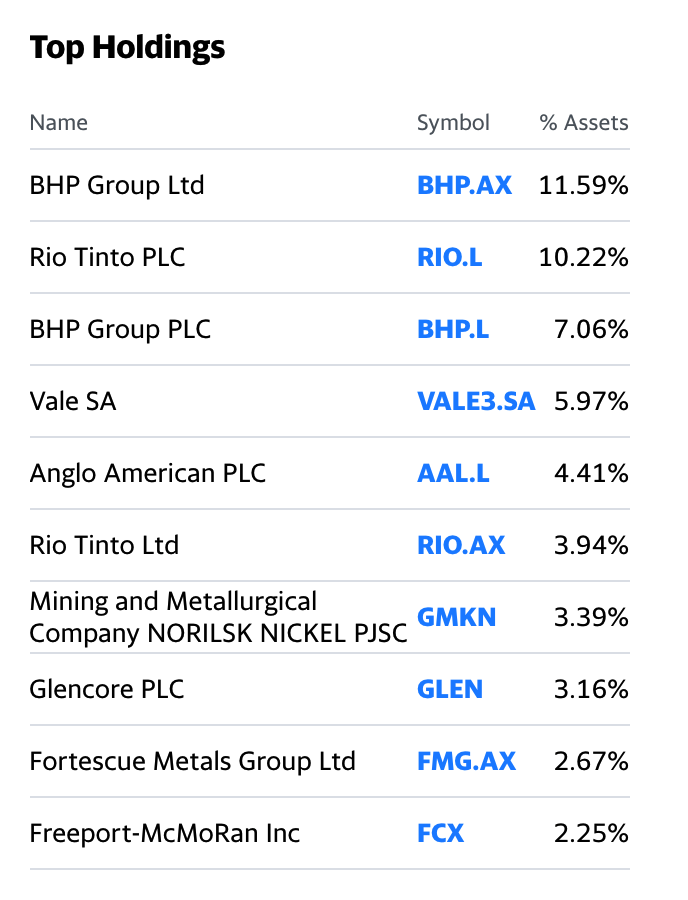
The iShares MSCI Global Metals & Mining Producers ETF owns shares in the leading companies that extract and process base metals worldwide. The fund's most recent top holdings include BHP Billiton (NYSE:BHP), Rio Tinto (NYSE:RIO), Vale (NYSE:VALE), Anglo American (OTC:ANGPY) and Freeport-McMoran (NYSE:FCX):

Source: Yahoo Finance
PICK has net assets of $178.82 million, trades an average of 83,907 shares each day, and charges a 0.39% expense ratio. PICK pays shareholders an average dividend of just over 7%. Holding the product for one month can more than compensate for its expense ratio. And of course, in the current environment, a 7% yield is extremely attractive.
If 2008-2011 is a model, PICK has lots of upside potential
The US Federal Reserve and central banks worldwide are flooding the global financial system with unprecedented liquidity to stabilize and stimulate the economy, as it faces the pandemic. At the same time, governments are providing significant fiscal stimulative measures. The amount is far higher than during the 2008 global financial crisis.
From June through September 2008, the US Treasury borrowed $530 billion to fund the stimulus. In May, they borrowed $3 trillion, and that number is likely to rise.
The risk-off period in 2008 took commodities prices appreciably lower.

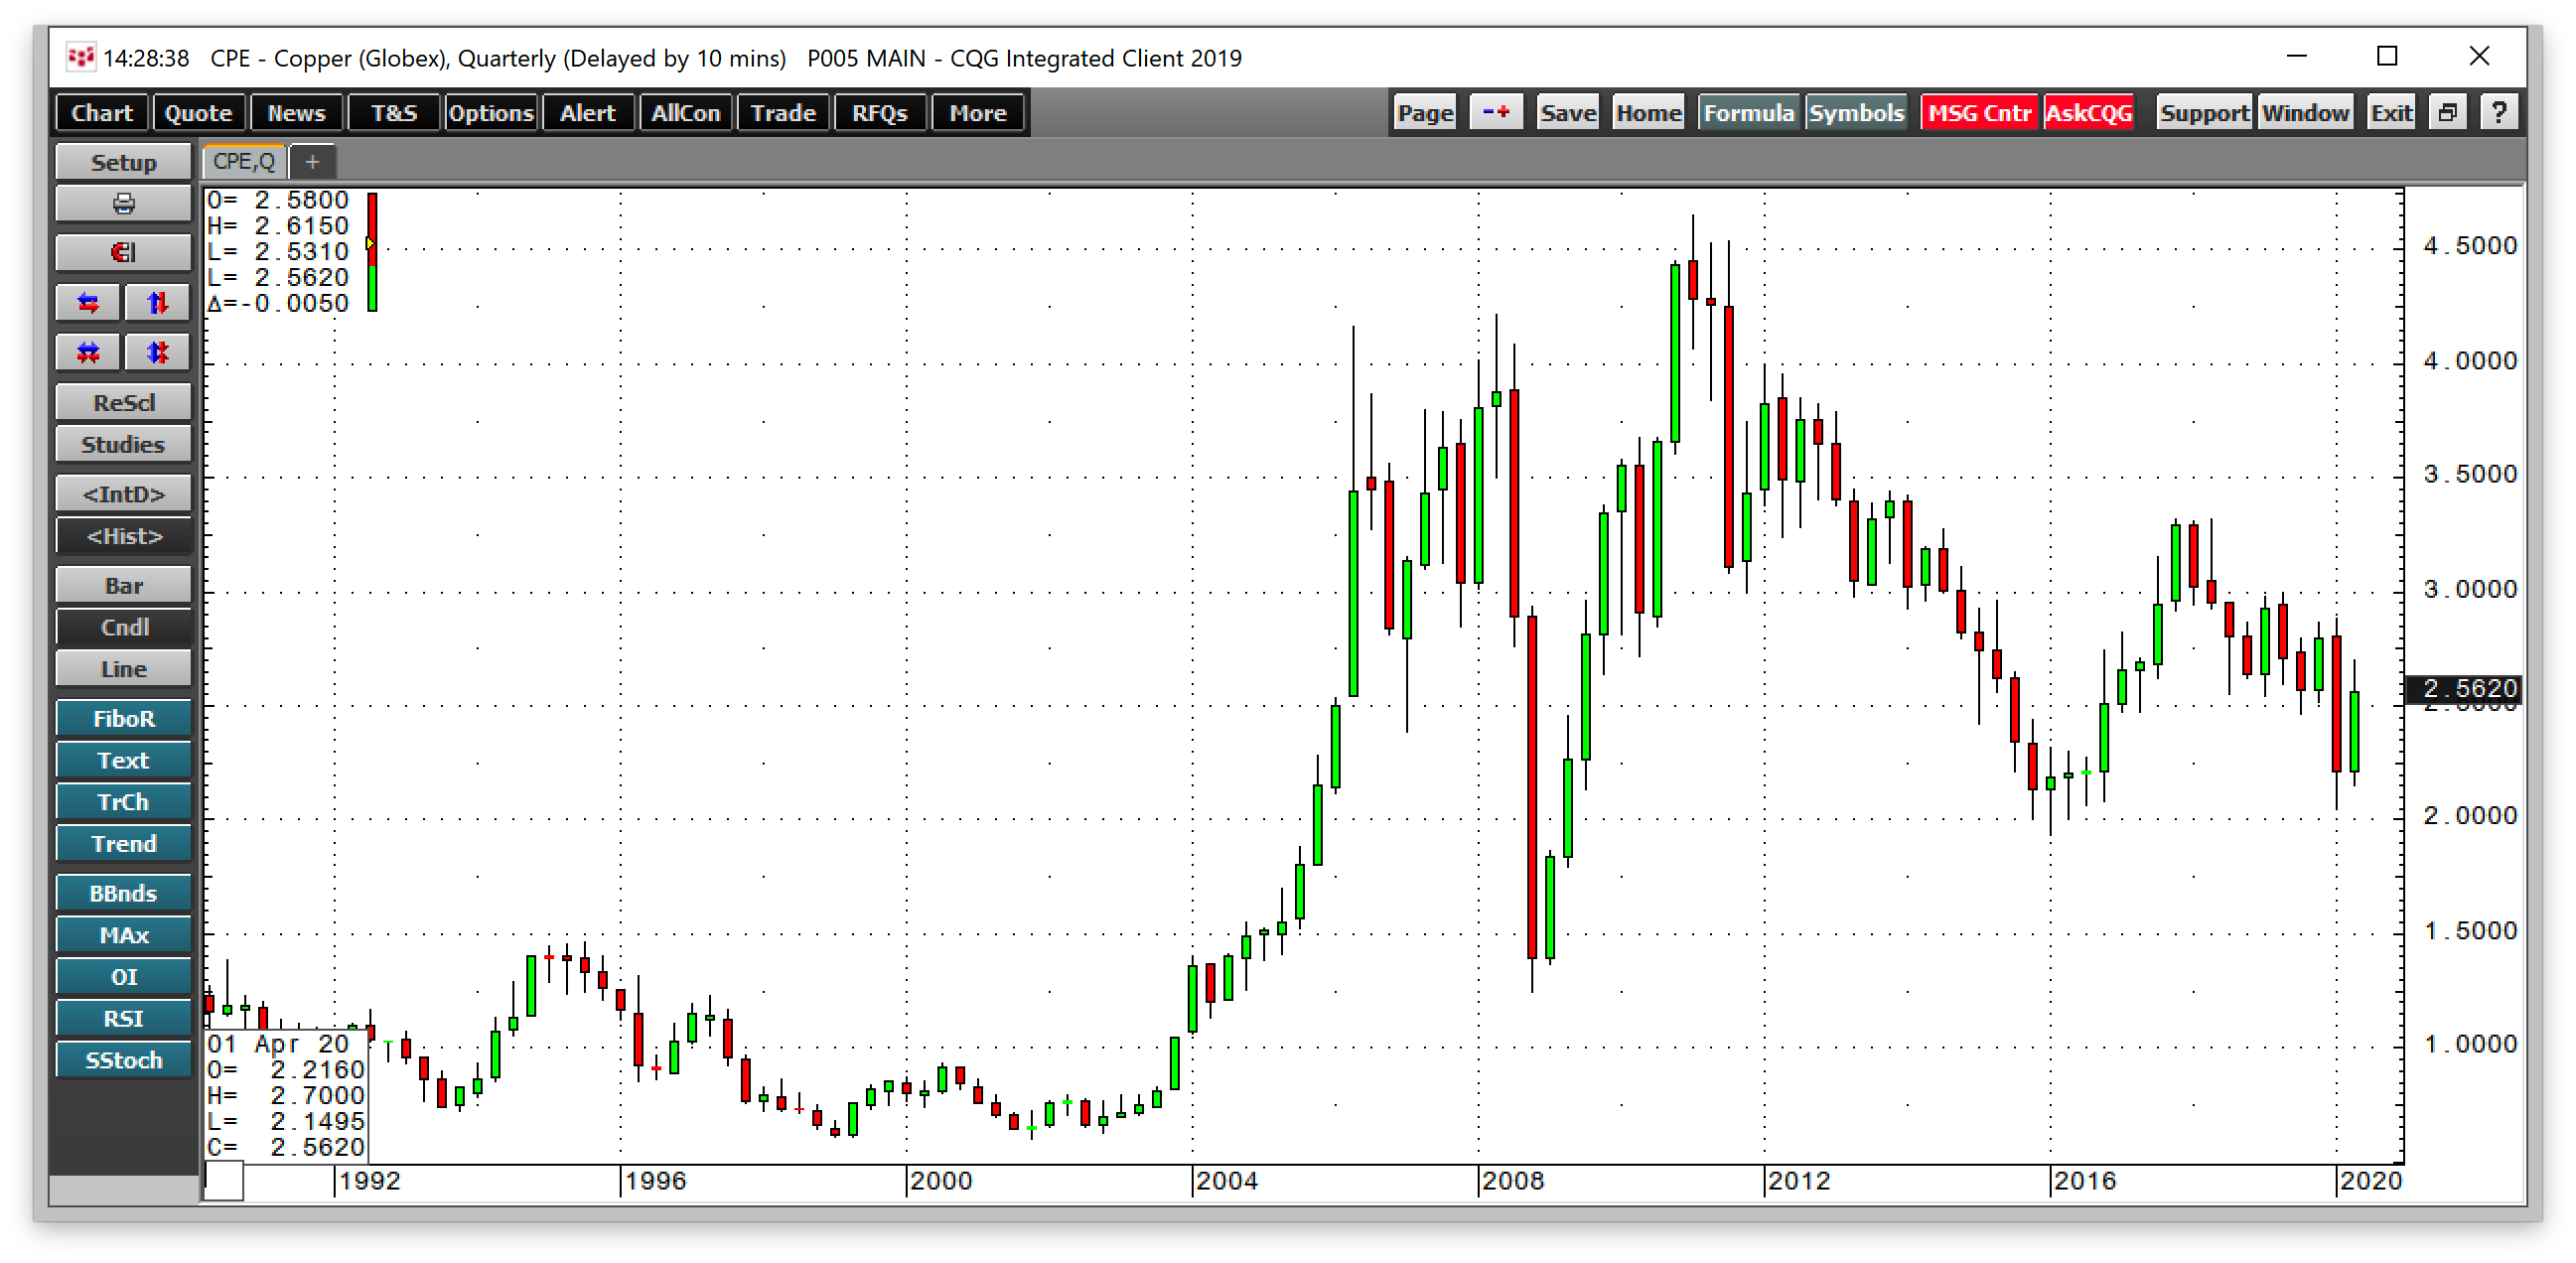
The quarterly chart shows that the price of copper futures fell from $4.2160 to a low of $1.2475 per pound over seven months in 2008. Many other commodity prices followed copper lower over the period.
The stimulus ignited a significant rally that reached a peak in 2011, with copper rising to an all-time high of $4.6495. Many other commodities also appreciated to peaks from 2008 through 2012. The stimulus played a significant role in the secular rally in raw material prices.
Since the level of stimulus is far higher in 2020, we could be on the verge of a similar move in commodities over the coming months and years.

Source: Barchart
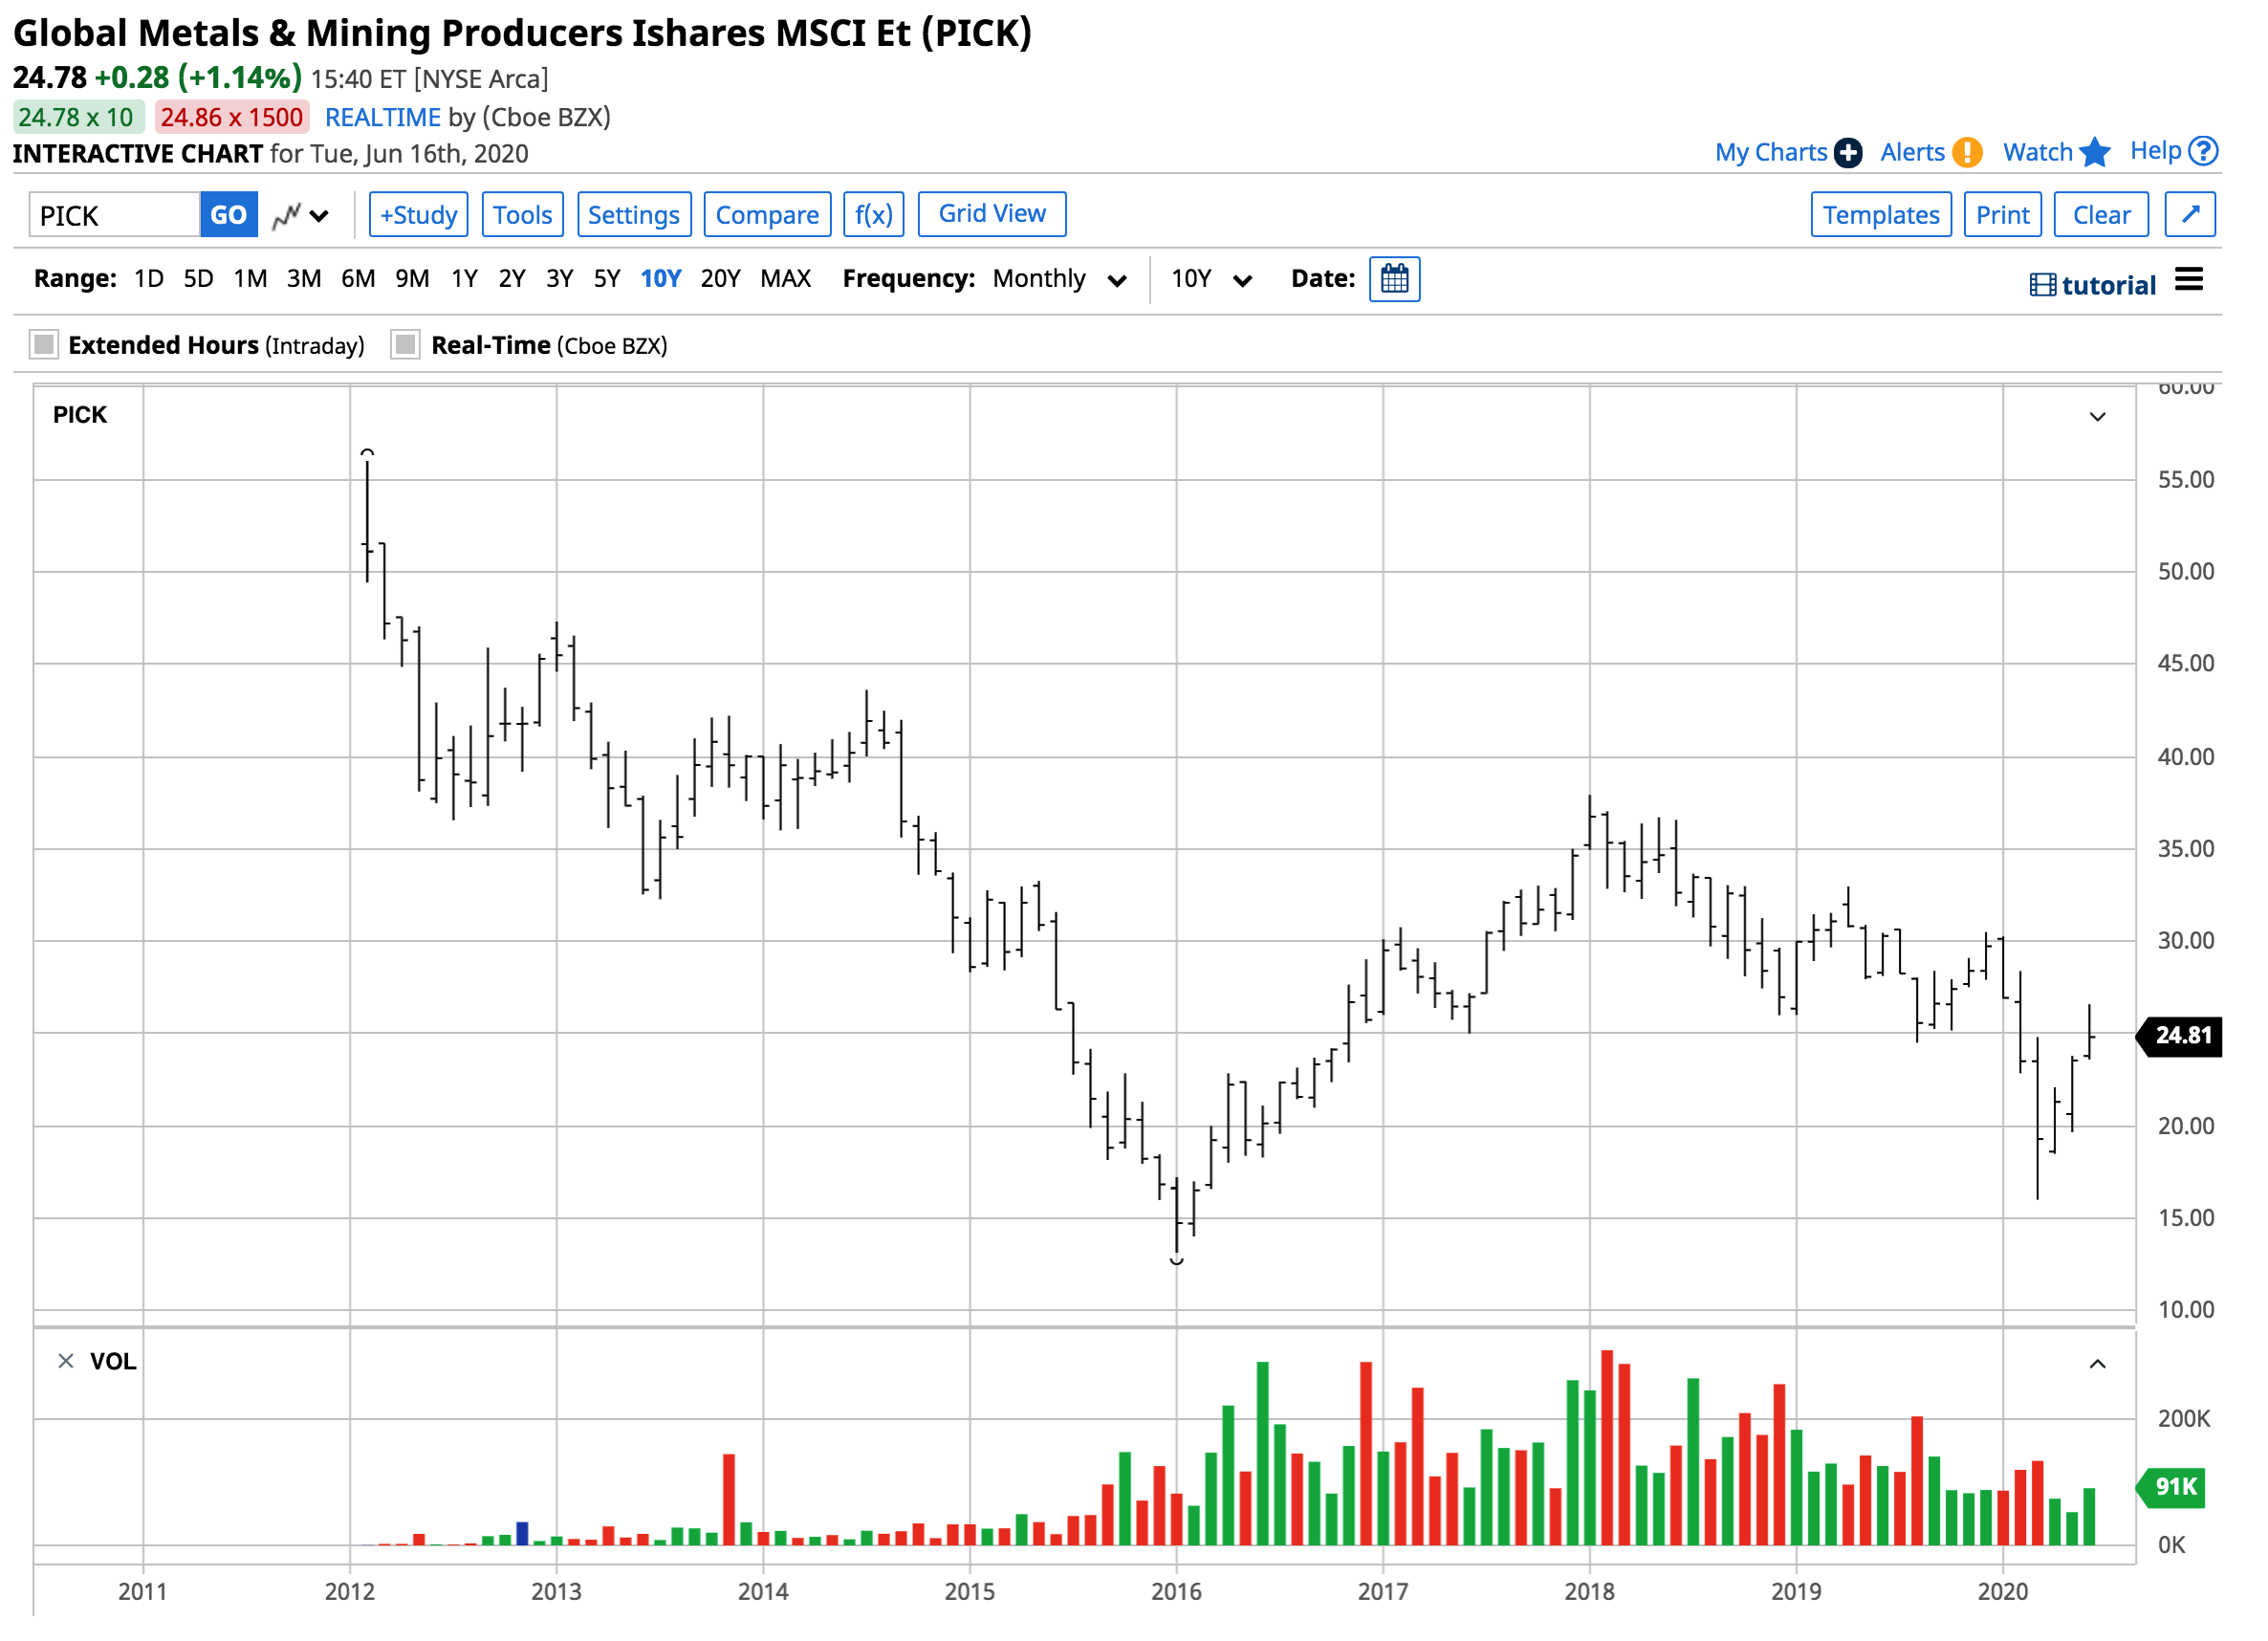
The chart above illustrates that the PICK ETF reached a high of $56 per share in early 2012, while commodities prices were still at lofty levels. PICK dropped to a low of $16.01 in mid-March, but has since recovered somewhat, trading at below $25 per share on June 16.
If the stimulus is setting the stage for a rally in commodities, PICK's holdings in the leading companies in the sector will benefit from higher commodities prices. The ETF has an almost 29% exposure to BHP and RIO; both are significant nonferrous metals producers. The other holdings comprise an impressive and diversified list of global mining companies.
If 2008 is a model for 2020, PICK could be the perfect addition to your portfolio.
