I continue to see the U.S. economy enjoying another full period of outsized real growth. Why? Let me count the ways: the surge in pent-up demand from the pandemic, robust monetary and fiscal stimulus, business re-opening, nothing but “Now Hiring” signs everywhere, and a continuing rise in business, as well as consumer confidence.
Add to this the record savings rate, the rebuilding of business inventories (supply chain issues will be overcome!) and the desire of so many, now freed from mandatory urban employment, to change their location.
This does not mean that US markets will go up every day, nor even every month. Typically, after a major decline like we saw in early 2020, the market will recover as investors begin to buy what are then relative bargains. Corporate earnings, however, take longer to come back.
Once those earnings show excellent comparisons year-on-year, though, a strange thing happens. Investors sitting on nice profits begin to think, “This can’t last.” The result, even in the face of stellar earnings growth, is they begin to sell.
There are many willing buyers who stayed on the sidelines, not believing the market could rise so far, so fast. They are now willing to buy. The result of this many sellers selling and this many buyers buying has historically meant a sideways market just when earnings are rising the fastest!
Even the International Monetary Fund raised its 2021 U.S. GDP forecast by a big leap, to 6.4%. All this bodes well for US companies and their listed shares—in the long term. But in the short term, some are priced to perfection and no matter the long-term delight, short term panics / second thoughts / corrections will occur.
The greatest threat is inflation. We are now looking at worst-case scenarios caused by the reckless expansion of spending put forth by the current administration. However, this decision to spend, spend, spend is not really in a president’s bailiwick. He can request it, but only Congress can decide upon the budget. I would not be surprised if a number of Democratic members of Congress, up for re-election in 2022, might suddenly acquire a more fiscally responsible outlook.
If the IMF is correct (I believe their forecast in this case is a good one, even though it is the IMF!) I predict US GDP will outpace China’s for the first time in 16 years. The demographic and employment problems in China look to be coming home to roost.
I believe we are in one of those typical sideways moments currently. But some sectors will do better than others. And I think residential real estate will be the most profitable industry in which to invest right now.
If someone can buy a 3-bedroom home in Austin, Denver, Tampa etc. for the same rental outlay they are paying for an 800 square foot apartment in New York City, chances are some people are going to support the building of new homes for some time. Others are going to move, especially to Sun Belt cities, simply because they can, and they can rent (or buy) a mansion for what they are paying now for a dinky urban apartment.
I have just purchased an ETF I discovered that hits all the high notes in terms of areas covered for the likelihood of continued homebuilding and home buying. It is the Hoya Capital Housing ETF (NYSE:HOMZ), a mostly large- and mid-cap value ETF. The index they follow is the Capital Housing 100 Index. The index is composed of 100 companies that collectively represent the performance of the U.S. residential housing industry. The index is designed to track total spending on housing and housing-related services across the U.S.
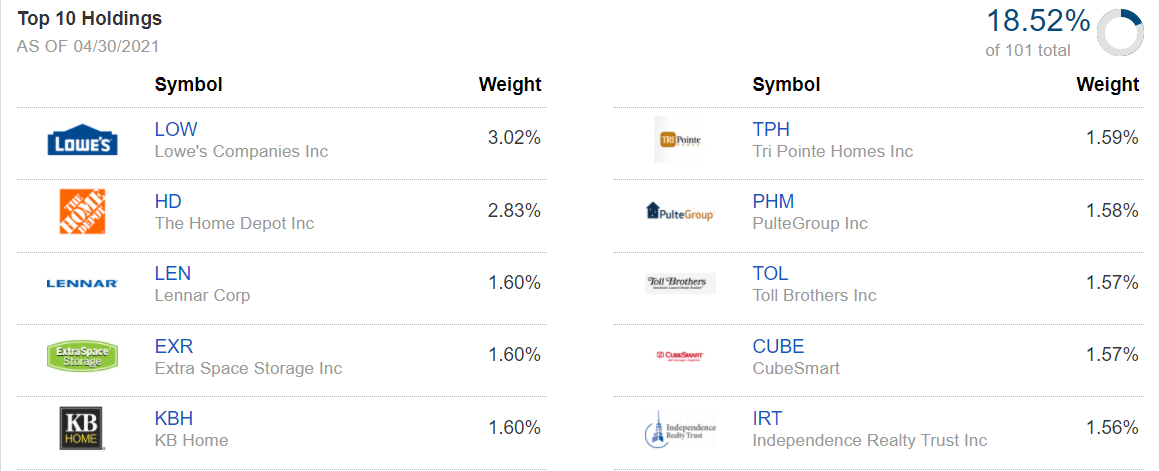
HOMZ does this by owning companies that cover the residential waterfront. They do not just own the homebuilders, they also have in their portfolio household durables, home furnishings, general contractors and operative builders, management and development companies, residential real estate investment trusts (REITs), and firms in the real estate services sectors. Here are their Top Five holdings—Lowe’s (NYSE:LOW), Home Depot (NYSE:HD), Lennar (NYSE:LEN), Extra Space Storage (NYSE:EXR), KB Home (NYSE:KBH):

Source: Fidelity.com
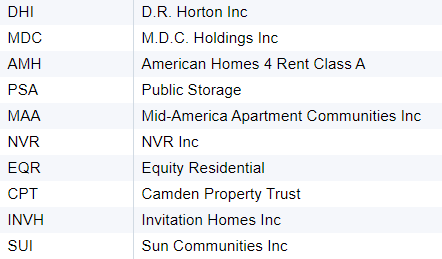
Their next 10 holdings aren't slouches either: DR Horton (NYSE:DHI), MDC (NYSE:MDC), American Homes 4 Rent (NYSE:AMH), Public Storage (NYSE:PSA), Mid-America Apartment Communities (NYSE:MAA), NVR (NYSE:NVR), Equity Residential (NYSE:EQR), Camden Property Trust (NYSE:CPT), Invitation Homes (NYSE:INVH) and Sun Communities (NYSE:SUI) …

Source: Fidelity.com
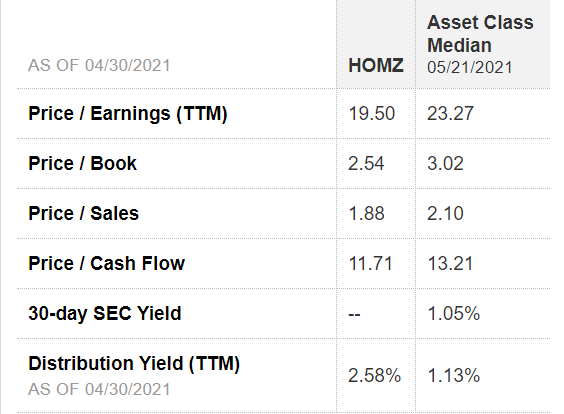
And please notice how their metrics compare to the asset classes represented in their portfolio:

Source: Fidelity.com
If you prefer individual holdings, I am also purchasing shares of a Canada-listed company that has as its portfolio significant apartment holdings in the US Sun Belt area, specifically key cities in Texas as well as some in Oklahoma City and Little Rock. The company is BSR Realty Investment Trust (OTC:BSRTF if purchased in the US). It closed yesterday at $12.50.
I especially like the valuation metrics of BSRTF. I think it has been lagging—so far—behind the price appreciation of US apartment REITs mostly because, as a US company which has chosen as its primary listing the Toronto Exchange in Canada (where it trades under the ticker HOM), they are overlooked.
Why is it overlooked? After all, Toyota is a Japanese company, yet we buy their shares. Nestle is a Swiss company, but we buy their shares. I believe as this one becomes better known it too will rise in value.
BSR is my way of enjoying growth in apartment rentals for those currently unable to buy, those relocating to a new city or those who prefer community apartment living for its convenience.
Interestingly, while BSR is listed on the Toronto Exchange as a primary listing, it is headquartered in the historic Union Station in downtown Little Rock, Arkansas. The management team knows the Texas-Arkansas-Oklahoma triangle especially well.
And yet, the company’s shares have barely moved in the past year. 22% in a year is excellent for an apartment REIT in normal times, but competitors have been double that in these unusual times. This one is still eminently buyable.
BSRTF’s FFO (Funds From Operations) is 18 and it yields 4.25%. As always, it’s the Quiet Ones that often have the greatest potential for surprise.
Disclosure: Unless you are a client of Stanford Wealth Management, I do not know your personal financial situation. Therefore, I offer my opinions above for your due diligence and not as advice to buy or sell specific securities.
