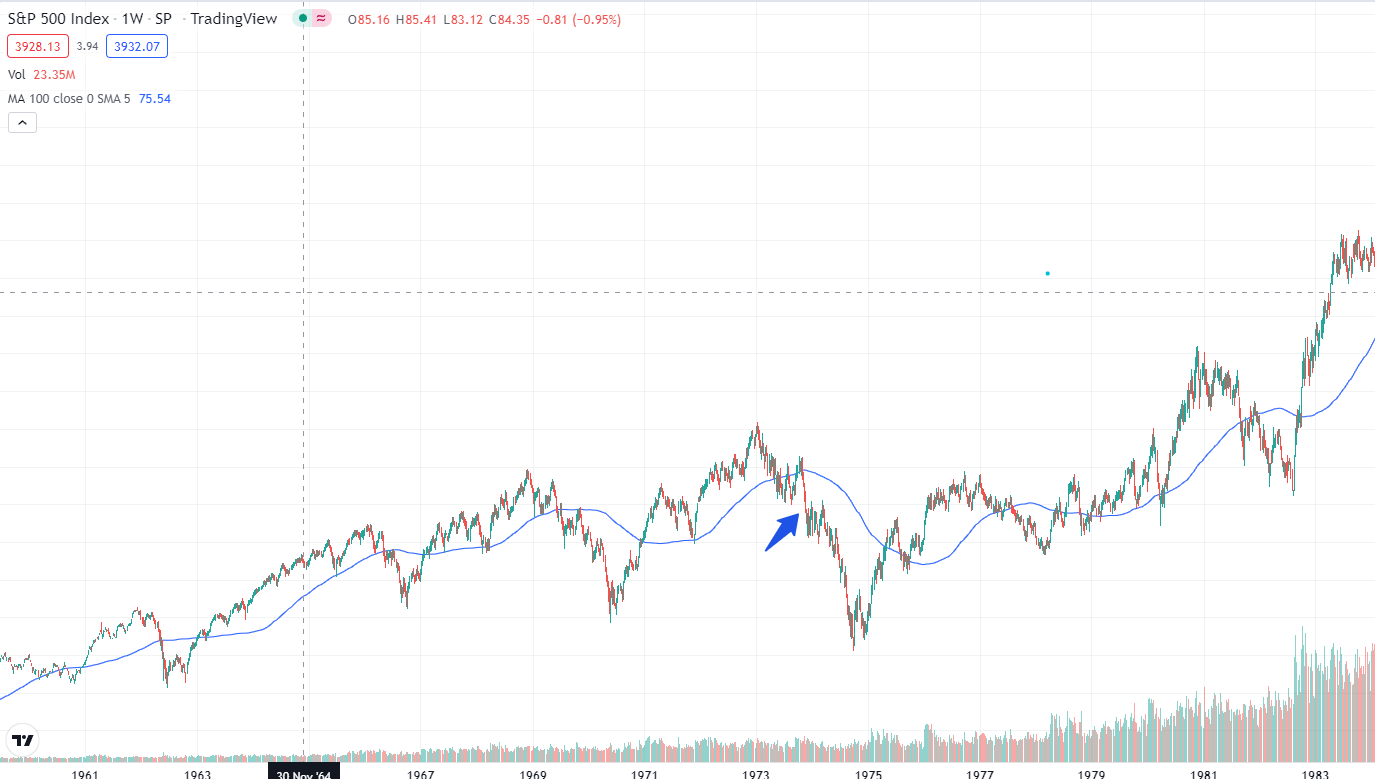
If this really is the repeat of 1970s-style stagflation and bear markets, then this is about where the S&P 500 current stands, down around 20% from its record high...so lots further to run? Buyers remain cowed by the sharp descent of the market, the Nasdaq down about 30%, the S&P 500 20%, from their all-time highs. Previously, this sort of decline has been the line in the sand, but the macro, by which I really mean the Fed, backdrop is totally different. The put is gone and it’s tightening – Powell warns this will mean ‘some pain’, and he’s just talking about mortgages. Don’t fight the Fed, don’t fight the tape.

It was another rollercoaster for US stocks yesterday but, in the end, the major indices closed flattish. Sellers ran out of momentum for the time being as markets entered oversold conditions, but buyers are not latching onto rallies and remain rightly hesitant. European stock indices are broadly higher in early trading on Friday. Mixed bag for the week so far with the DAX set to end up more than 1%, the FTSE 100 down a similar margin and the CAC 40 in Paris flat. It’s been a much tougher week in the US due to the tech weighting – Nasdaq sitting more than 6% lower for the week ahead of the final day of trade, the S&P 500 down almost 5%. But futures are indicated higher at the moment.
Vix still not doing an awful lot, which reflects the slow grind lower and lack of momentous capitulation. It also suggests there is not abject fear year as some corners of the market hold up. Blanket throwing in the towel yet to occur which actually makes it harder to trade or call. About a third of Nasdaq and NYSE stocks made a 52-week low.
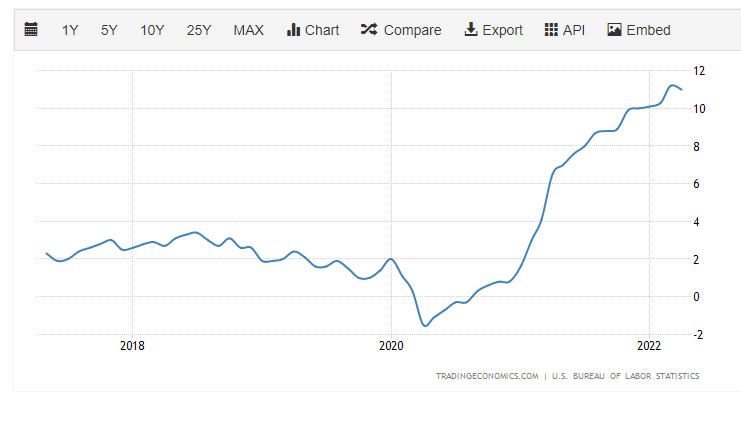
Month-on-month core PPI came in much lower than expected, 0.4% vs. the 0.6% forecast, declining sharply. But the year-on-year PPI is +11%, still exceptionally high.

With PPI numbers like this and a rise in weekly jobless claims, it’s looking harder and harder to see how the Fed will engineer a ‘soft landing’ for the economy. "So, a soft landing is, is really just getting back to 2% inflation while keeping the labour market strong. And it’s quite challenging to accomplish that right now, for a couple of reasons.” One of which was the failure by the Fed to get ahead of the inflation curve last year – all that ‘transitory’ nonsense etc. Now, Powell must admit that taming inflation will involve 'some pain'.
Sterling...no relief on comments from Dave Ramsden, who yesterday said there is a risk that inflation remains elevated for a lot longer than hoped. “Certainly, on the basis of my current assessment of prospects, we’re not there yet in terms of how far monetary policy has to tighten,” he said, adding: “Given what we know about the UK labour market, I wouldn’t be surprised if it turned out to be a bit tighter … I think there are upside risks on inflation the medium term.” GBP/USD took a fresh cycle low with a 1.21 handle, though there is some pause today in the selling.
Oil – OPEC lowered its demand forecast for the year to 3.3m bpd, down 310k from its previous forecast. But output continues to fall behind the pledged volumes and the worry is long-term decline in capacity due to a lack of investment. Whilst US shale kept $150 at bay for a number of years, it’s not riding to the rescue this time. Any demand destruction won’t make up for the loss of supply on the horizon.
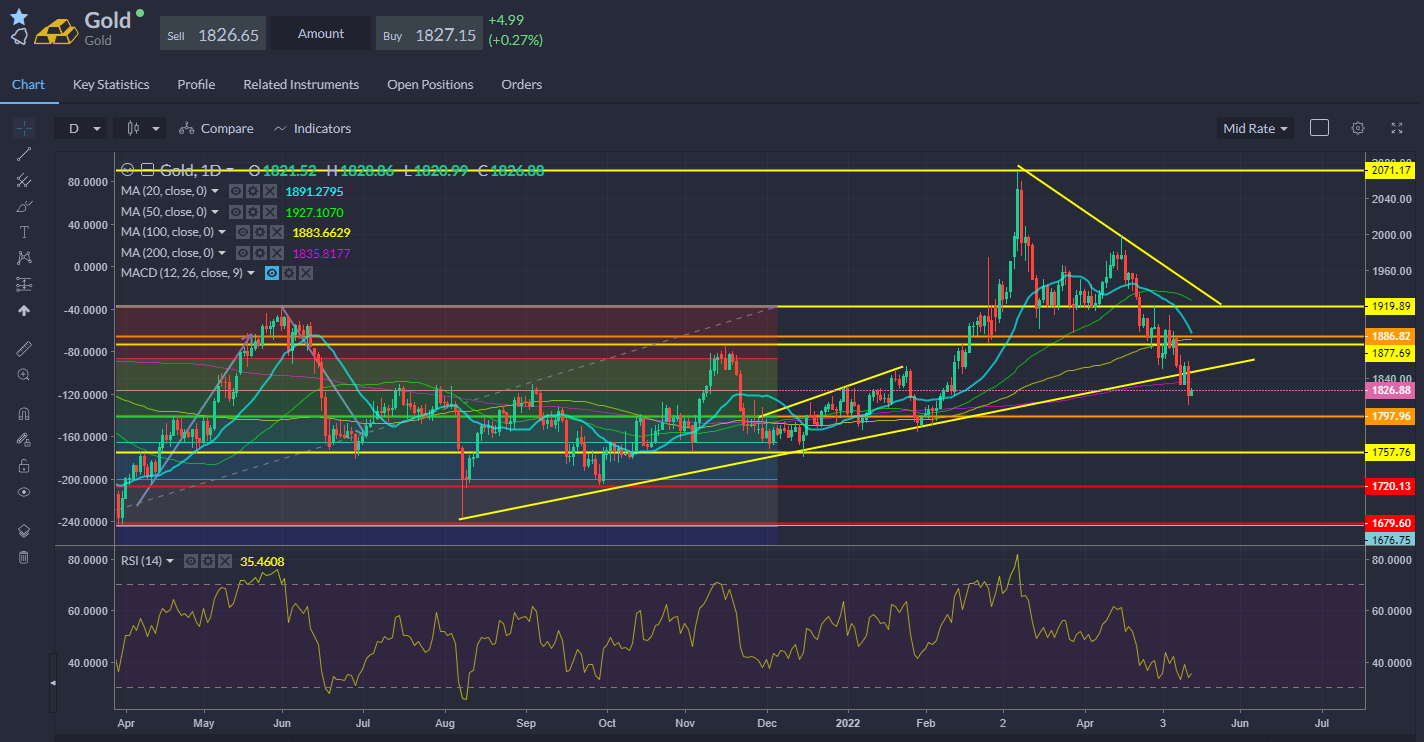
Gold – breakdown at the 200-day SMA and trend supports appears bearish.

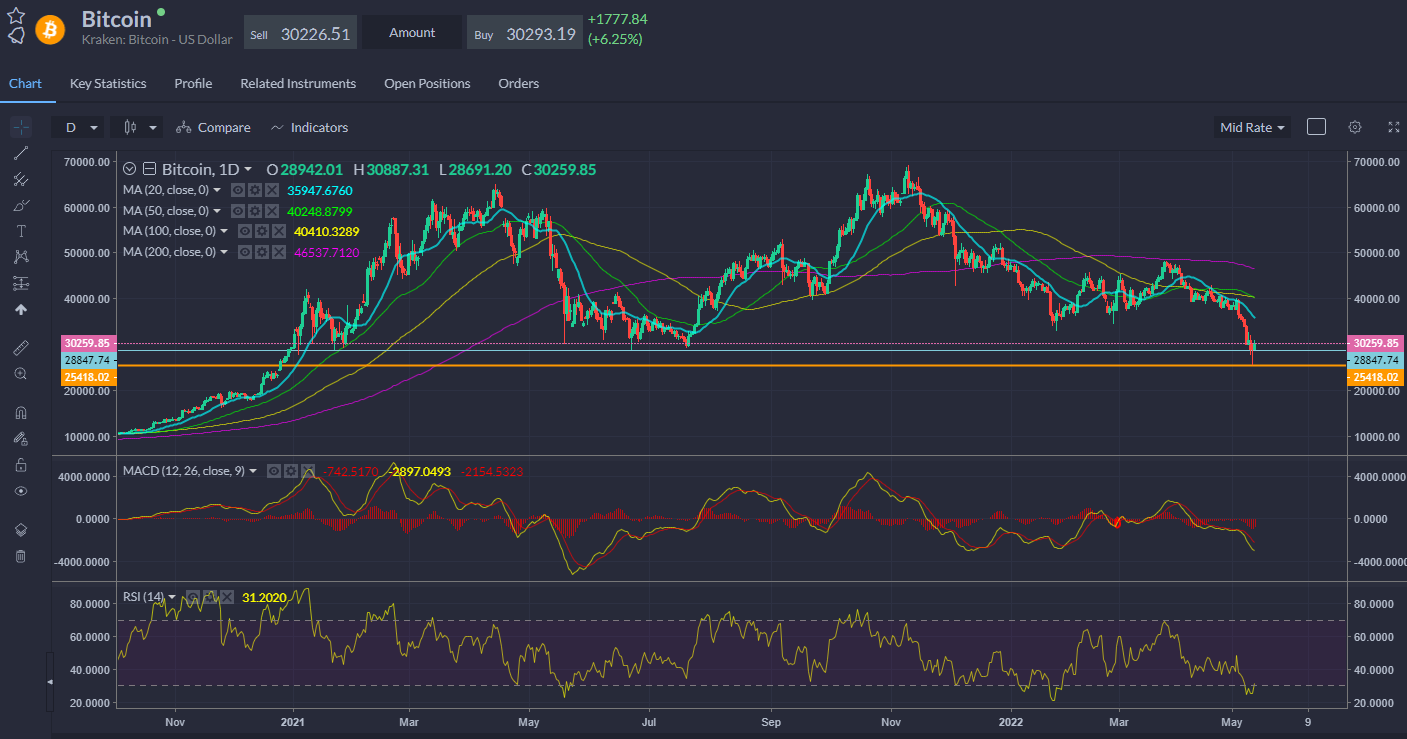
Finally, Bitcoin rallied to $30k, perhaps a short-covering bounce, perhaps HODLers flexing some muscles and averaging in some more. Was technically oversold, let’s see if this level now acts as a support. Beware weekend risk is high.

