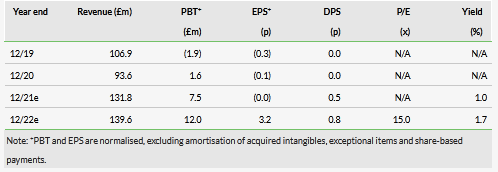
Foxtons (LON:FOXT) has traded well ytd, with total revenue exceeding £100m and only c £3m short of the £106.9m reported for the whole of FY19. The company has not only benefited from the implementation of its strategy, but also from a recovering sales market and improving lettings market where rental rates recovered sharply during the quarter. It enters the final quarter with a sales pipeline of properties ‘under offer’, which is 20% higher than at the same point in 2019. We value the shares at 128p, slightly reduced from our previous 130p, as costs are likely to increase modestly.

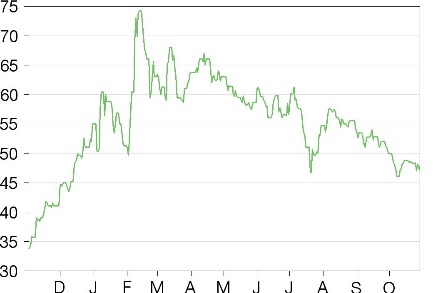
Share price performance

Business description
Foxtons Group is London’s leading and most widely recognised estate agency. It operates from a network of 57 interconnected branches offering a range of residential-related services, which are split into three separate revenue streams: sales, lettings and mortgage broking.
9M21 revenue up 50% y-o-y, up 24% versus 2019
Foxtons reported headline revenue of £103.6m for the nine months of FY21 (9M21), up 50% on the same period in 2020 and up 24% versus 2019. Stripping out the effect of the Douglas & Gordon (D&G) acquisition in March, underlying revenue grew 10% versus 2019. Q3 revenue grew 16% to £36.6m versus 2019 and was up 1% on the same basis. Overall revenue growth was primarily driven by lettings and sales with mortgage broking revenue largely flat on a two-year view. Foxtons ended the period with net cash of £24.5m, after spending £1.6m of the £3m share buyback programme announced in the H1 statement.
Cost increases imply modest reduction in forecasts
Revenue growth was in line with our full-year expectations, but Foxtons incurred one-off costs this year and, further out, we expect employment costs (national insurance contributions) and energy costs to accelerate. We have therefore reduced our operating profit forecasts by c £0.5m in each of the forecast periods.
Valuation: Revised to 128p/share, >2x the share price
Our base case shows 2022e EPS of 2.2p, which gives a valuation below the current share price when we apply the average 2014–15 P/E of 17.5x. If we roll our forecasts forward to 2023, our basic adjusted and diluted EPS of 2.7p implies a valuation of 45.5p, broadly similar to the current price. However, we would argue that future growth may not be fully reflected in the share price or our estimates as we do not forecast acquisitions. Our bull case highlights potential upside in forecasts, where Foxtons is particularly geared to further acquisitions of lettings books, as well as growth from Build to Rent (BTR), regional expansion and underlying markets. Our bull case scenario suggests a potential 2022 EPS of 7.3p, which implies a valuation of 128p/share when the 17.5x P/E is applied.
Click on the PDF below to read the full report:
