Market Overview
Market Overview
Anyone trading on Fed watch last night would have been left frustrated by the mixed messages given. It looked initially that Fed chair Powell was setting up for a hawkish cut. Removing the phrase “act as appropriate” from the FOMC Statement was seen as a move to a wait and see mode. It does, but then there was a distinctly dovish part of Powell’s press conference, when he discussed inflation, that has really put the dollar bulls on the back foot again. Powell said that the Fed was not interested in raising rates right now, but then cranked it up by saying it would take a “really significant” rise in inflation before they would consider hikes. Seeing as inflation has been very hard to come by for years, this appears a long way off. No rate hikes for the foreseeable future it would seem. With Treasury yields falling away, the dollar was hit across markets. Equally, we saw equities supported, whilst commodities such as gold and oil (which also tend to benefit from a weaker dollar) also rallied. The question is now whether this is an outlook changer.
Certainly for risk, this is a boost and we are seeing a continuation of this today. Chinese PMIs disappointed with the official Manufacturing PMI down at 49.3 (49.8 expected, 49.8 last) and the official Services PMI 52.8 (53.7 in September). The potential is that this disappointment will push the Chinese Government for further stimulus measures. As expected, the Bank of Japan left rates on hold at -0.1%.
Wall Street whipsawed around on the back of the Fed meeting to close with decent gains. The S&P 500 was +0.3% higher in further all-time high territory at 3046. US futures are all but flat today, but Asian markets have been mixed today with the Nikkei +0.4% and Shanghai Composite -0.5%. In Europe there is a continuation of the mixed theme, with the DAX Futures +0.2% and FTSE 100 Futures flat.
In forex, we see USD continuing to weaken across the majors, with NZD and AUD main outperformers, along with GBP and EUR. Even the safe haven JPY is strengthening. In commodities, the dollar negative theme is helping too, with gold sustaining yesterday’s rebound, silver mildly higher and oil showing a solid degree of support.
There is a big focus on inflation on the economic calendar today. First up is the Eurozone flash inflation for October at 1000GMT. Headline HICP is expected to drop back to +0.7% (from the final +0.8% in September), whilst core HICP is expected to remain at +1.0% (+1.0% in September. The flash reading of Eurozone GDP for Q3 is also at 1000GMT which is expected to grow by a meagre +0.1% for Q3 leaving the year on year GDP down to +1.1% (from +1.2% in Q2). The Fed’s preferred inflation gauge, core Personal Consumption Expenditure for September is at 1330GMT. Core PCE is expected to slip further away from the 2% target, back again to +1.7% (from +1.8% in August). Weekly jobless claims are at 1230GMT, are expected to once more be around recent levels at 215,000 (212,000 last week).
Chart of the Day – AUD/USD
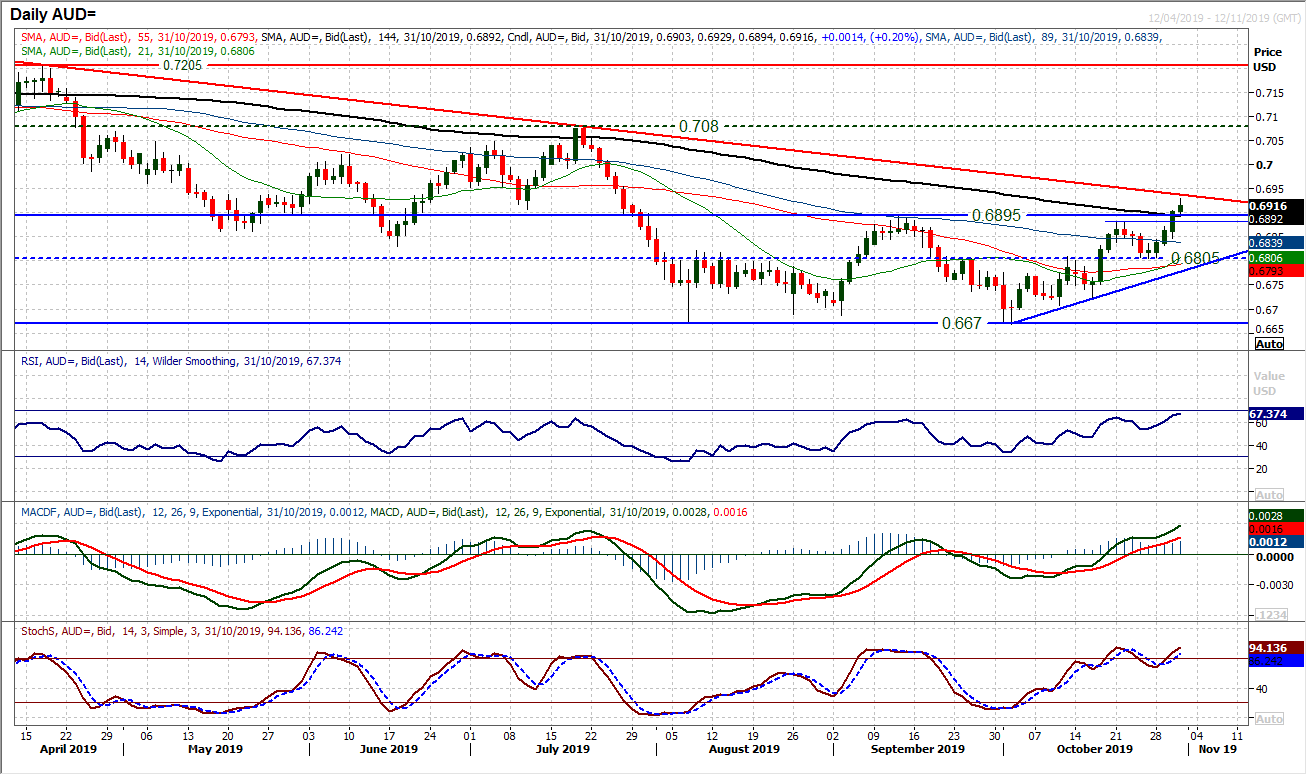
We spoke previously about a breakout on Aussie/Yen, and the outlook for the Aussie has continued to improve to an extent that AUD/USD has now broken through crucial resistance. The September high of $0.6895 marks the top of a three month trading range and this has now been broken. With the market having trended higher for the past four weeks, posting higher lows and higher highs, the candles have recently grown in magnitude of bullish strength, culminating in yesterday’s closing breakout. Momentum indicators are increasingly strong in configuration, whilst also showing further upside potential. The RSI is rising through the mid-60s, leading the breakout and at 12 month highs. Furthermore, MACD lines and Stochastics lines are also rising bullishly. It all suggests that near term weakness on the Aussie is now a chance to buy. The next technical test is the long term downtrend at $0.6940 today but there is something significant about this move building now. Given a 225 pip implied base pattern breakout the next resistance of note is at $0.7080. There is now a 50 pip bear term “buy zone” of support from the previous key high of $0.6895 and last week’s high of $0.6845.
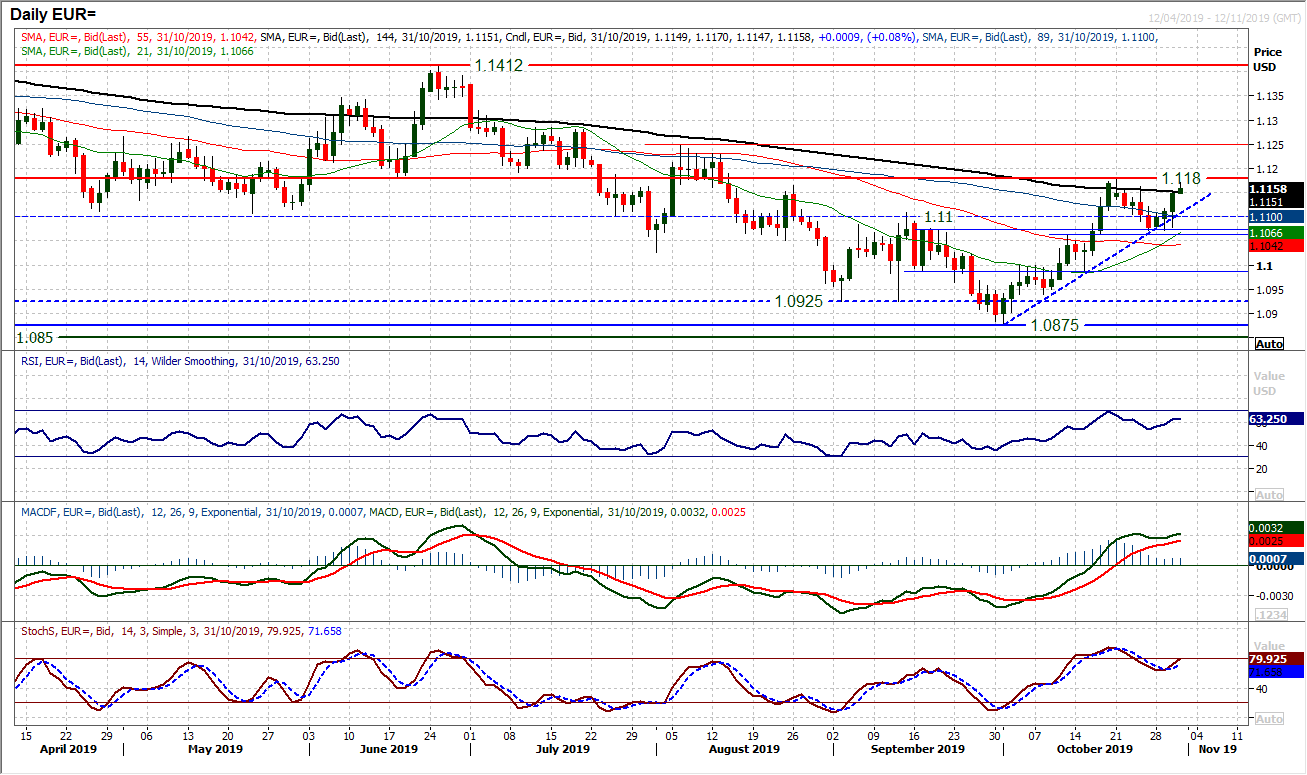
It has been a choppy period of trading on EUR/USD but the bulls are emerging on top. Throughout this week we have been discussing the importance of the $1.1160/$1.1175 support and this has held in each of the past four sessions. The Fed meeting was a real test as it looked as though the dollar was strengthening to breach the support, however Fed chair Powell talk of the need for a “really substantial” increase in inflation for a rate hike saw the dollar sold off again. A whipsaw move drove EUR/USD to climb decisively into the close, forming a very strong bull candle. That is now the third bull candle in a row and the market is suddenly eyeing a test of the key October high at $1.1180. Momentum indicators have been teetering through the choppy trading this week but a swing higher on Stochastics, MACD lines still rising and RSI back above 60 is all positive. Despite it having been breached on an intraday basis, the four week uptrend (at $1.1110 today) is still a gauge of support, whilst the old $1.1100 breakout will also be key now for how intraday weakness is treated. The pair needs a closing breakout above $1.1180 to open $1.1250 and the way the bulls are winning recent sessions, we see weakness as a chance to buy now.
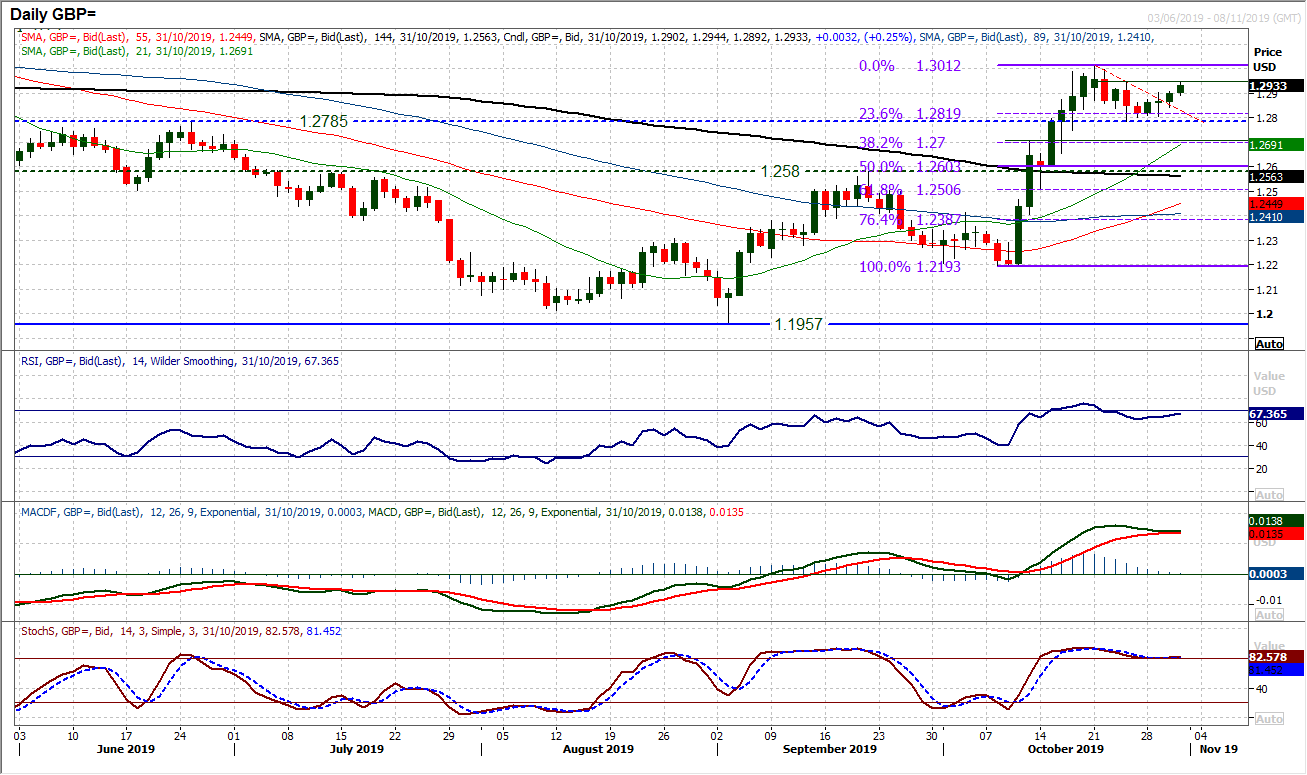
Political risk means that sterling has not reacted as positively to the Fed decision as the euro. Despite this, Cable has found enough support to see a third consecutive positive close. The most important takeaway from the past few sessions is that the support at $1.2785/$1.2820 is firming. Volatility on sterling has certainly dropped away in recent sessions and the question is whether this stability in the market will continue, we see no reason why not at this stage. For now, momentum indicators are looking settled and if anything lacking of direction, as the MACD and Stochastics plateau and RSI sustains between 60/70. A mild positive bias comes with the market having edged higher for the past three sessions and the lower high resistance at $1.2950 is the initial test for the bulls today. A breach would open the key October high around $1.3010. This positive bias is reflected in the hourly chart where the RSI is holding above mid-30s and pushing 70, whilst hourly MACD is above neutral. The post-Fed reaction low at $1.2840 is support of a higher low above $1.2785.
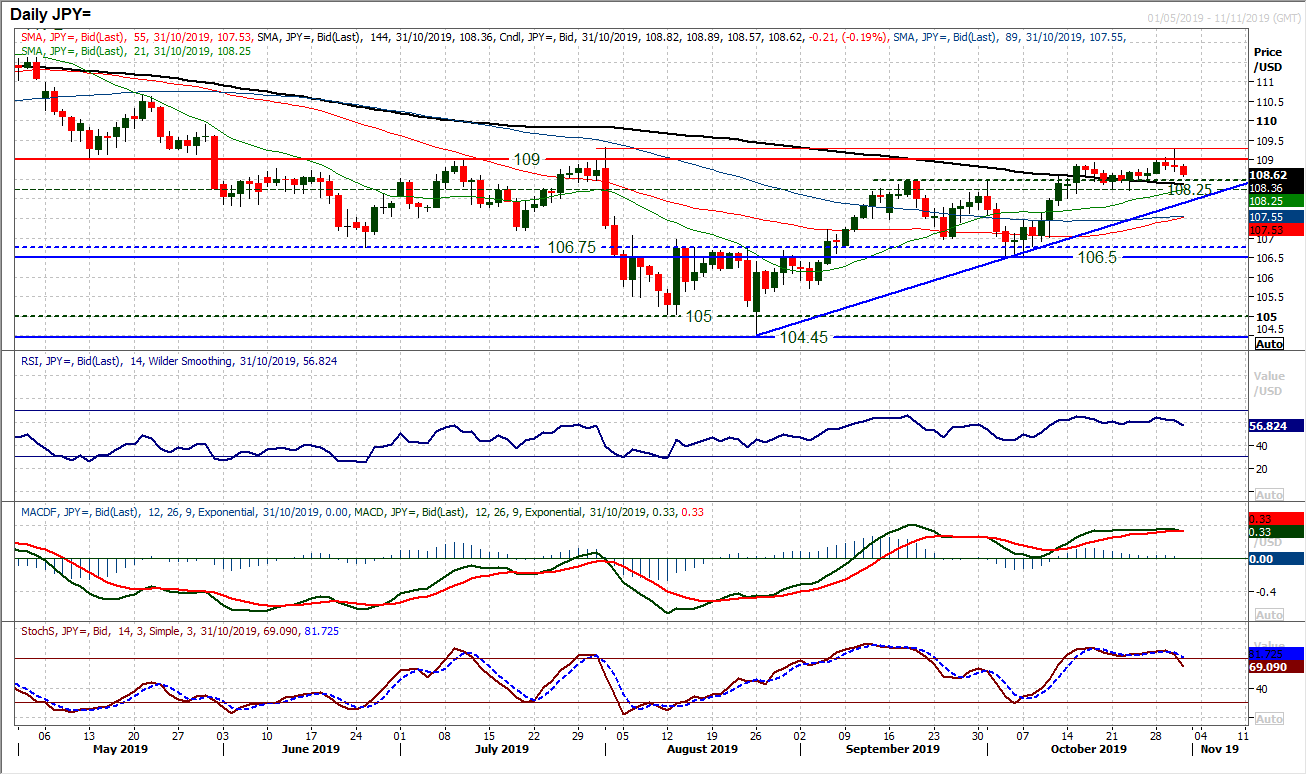
Is this a bull failure for the dollar? An intraday breakout above 109.00 was sold off into the close and the market formed a slightly bearish candle. However given the retreat over 40 pips back from what is another intraday spike high of 109.30, the bulls will be very wary now. There is still an uncertain feel to the market, but the momentum indicators are beginning to threaten to roll over now. There is no reversal as such yet but there is a feeling that the support band 108.50/108.70 needs to hold firm otherwise the selling pressure will gain momentum. The question now is how the bulls respond to the latest disappointment of failing to breakout. The hourly chart is taking a neutral configuration, but a negative bias is beginning to develop. Watch the daily Stochastics which are threatening a sell signal. Under 108.50 would reflect growing bear pressure, with 108.25 a key low and two month uptrend support at 107.90 today.
Gold
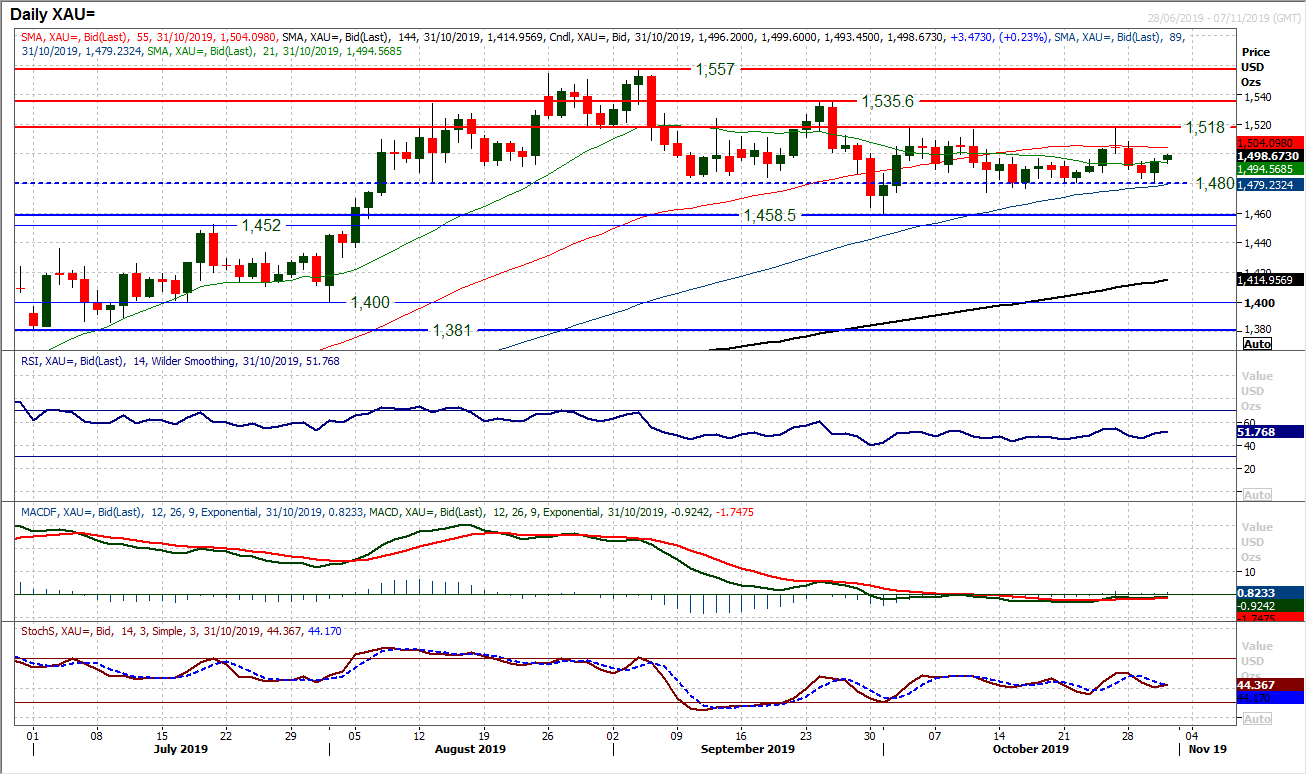
Anyone looking for clarity and direction on gold on the back of the Fed meeting will have been left scratching their heads. The initial stance of mild hawkishness from Powell dragged gold back to the $1480/$1481 support band, but when he talked of the need for really substantial inflation for a rate hike, gold swung back over a percent higher. Ultimately, all supports and resistance levels of note that we talked about prior to the Fed are still intact. The importance of $1480 is growing, whilst the market is back into the $1497/$1500 resistance area. Daily signals are again giving nothing on direction, and arguably even less than yesterday as the Stochastics again look to bottom. When a period of oscillation between 43/55 on RSI now stretched to four weeks, you know this is a market in consolidation. Broadly, gold needs a close above $1518 or below $1480 to suggest any realistic direction. Sitting bang in the middle of this today, we are no closer to finding it. The argument is that a tiny positive bias is now in the hourly configuration, but nothing of any conviction.
WTI Oil
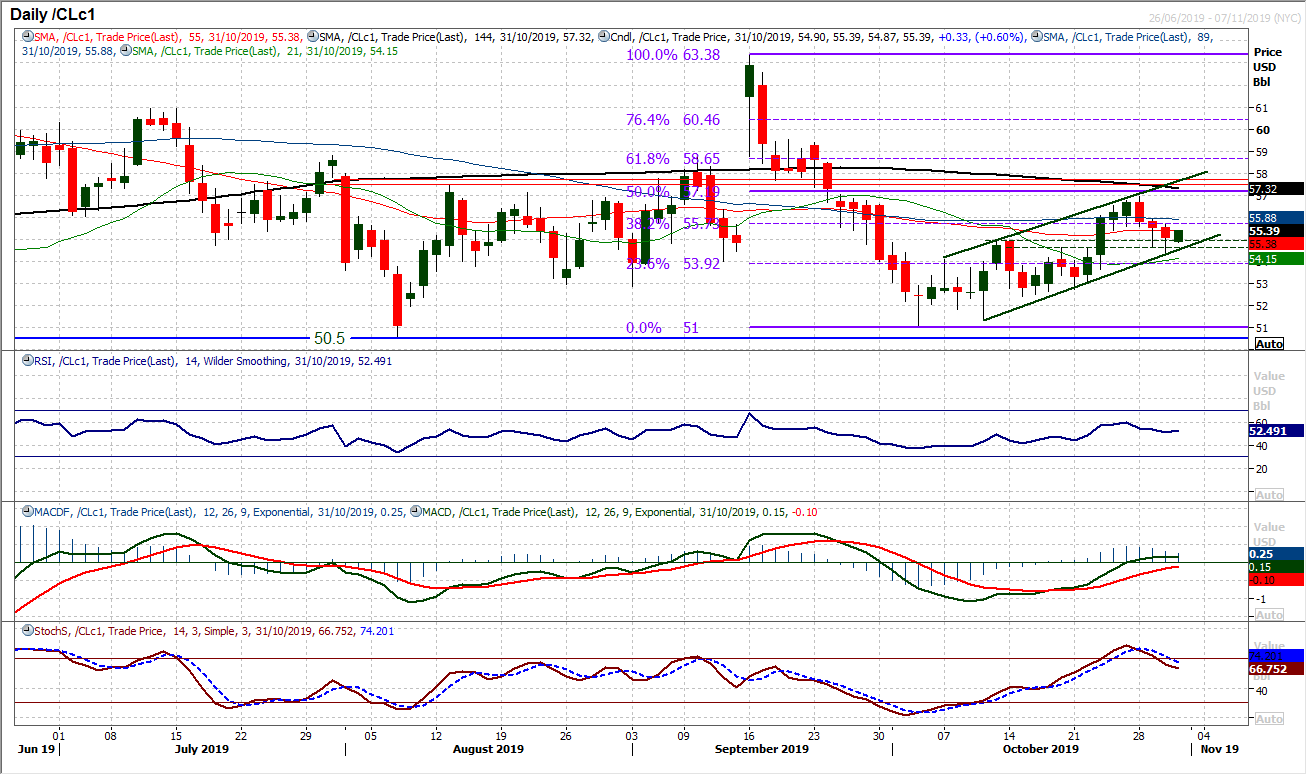
The corrective move within the uptrend channel continued lower for a third straight session yesterday. This is now the point where the bulls need to show themselves again. A support band $54.60/$54.95 saw an intraday breach yesterday but in bouncing from $54.40 the market held the band into the close, whilst the channel support (rising today at $54.60) also held. The concern is that momentum indicators are rolling over as the Stochastics are weighed down after three negative candles in a row. There needs to be a reaction today and initially, the market is edging higher and again hanging on to the support band $54.60/$54.95. If this continues to hold, then playing the channel higher and buying into the weakness could emerge. A move above resistance at $55.75/$55.95 could be the catalyst for another swing higher.
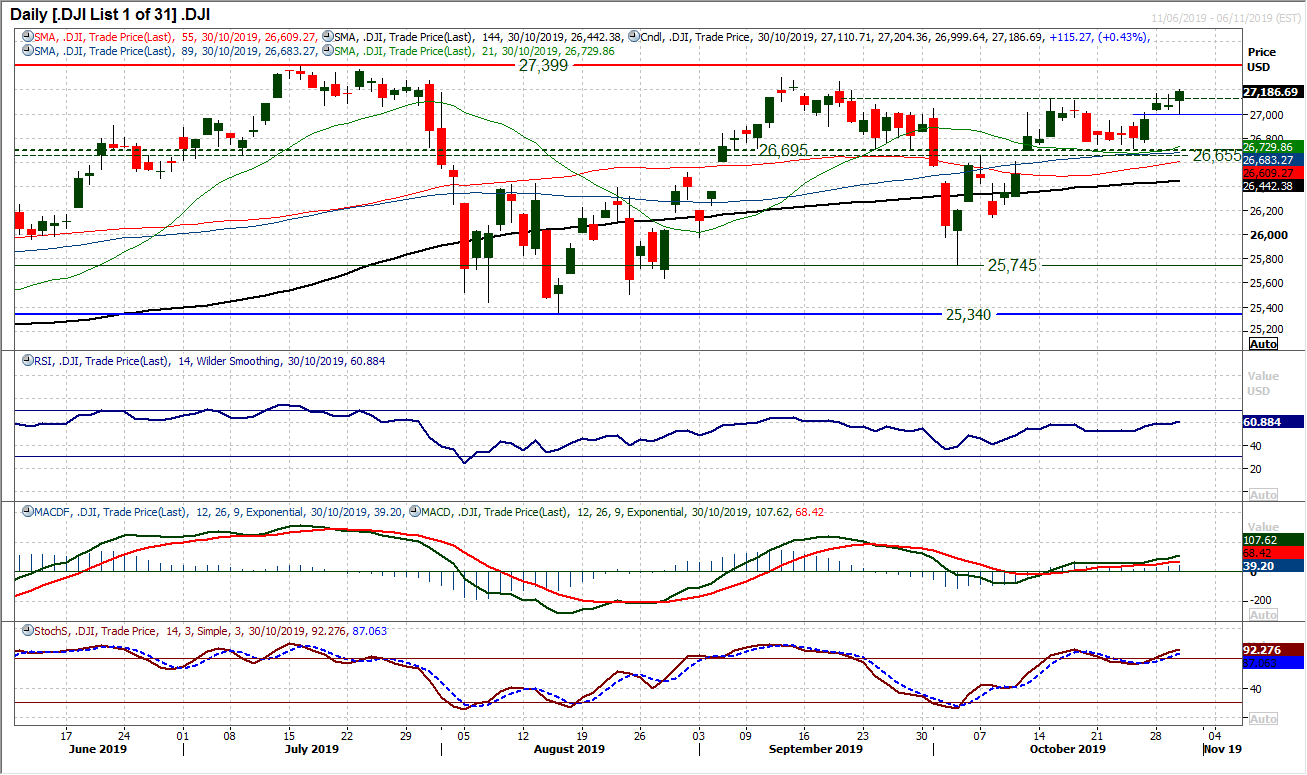
As the dust settles in the wake of the FOMC decision, US equities pulled higher. An intraday slip on the Dow found support at 27,000 to close clear of recent resistance and at a five week high. The candlestick, being a bullish engulfing, is certainly positive for the near term outlook and the bulls will be eyeing the September high at 27,307 and the all-time high of 27,399. Momentum indicators are with the breakout, as RSI moves into the 60s and confirm the five week high. The outside day session now leaves 27,000 as a key near term marker as weakness is now a chance to buy. Hourly indicators show strength but also upside potential in the breakout. All the signals are now aligned for further gains to test the highs.
"""DISCLAIMER: This report does not constitute personal investment advice, nor does it take into account the individual financial circumstances or objectives of the clients who receive it. All information and research produced by Hantec Markets is intended to be general in nature; it does not constitute a recommendation or offer for the purchase or sale of any financial instrument, nor should it be construed as such.
All of the views or suggestions within this report are those solely and exclusively of the author, and accurately reflect his personal views about any and all of the subject instruments and are presented to the best of the author’s knowledge. Any person relying on this report to undertake trading does so entirely at his/her own risk and Hantec Markets does not accept any liability. """
Anyone trading on Fed watch last night would have been left frustrated by the mixed messages given. It looked initially that Fed chair Powell was setting up for a hawkish cut. Removing the phrase “act as appropriate” from the FOMC Statement was seen as a move to a wait and see mode. It does, but then there was a distinctly dovish part of Powell’s press conference, when he discussed inflation, that has really put the dollar bulls on the back foot again. Powell said that the Fed was not interested in raising rates right now, but then cranked it up by saying it would take a “really significant” rise in inflation before they would consider hikes. Seeing as inflation has been very hard to come by for years, this appears a long way off. No rate hikes for the foreseeable future it would seem. With Treasury yields falling away, the dollar was hit across markets. Equally, we saw equities supported, whilst commodities such as gold and oil (which also tend to benefit from a weaker dollar) also rallied. The question is now whether this is an outlook changer.
Certainly for risk, this is a boost and we are seeing a continuation of this today. Chinese PMIs disappointed with the official Manufacturing PMI down at 49.3 (49.8 expected, 49.8 last) and the official Services PMI 52.8 (53.7 in September). The potential is that this disappointment will push the Chinese Government for further stimulus measures. As expected, the Bank of Japan left rates on hold at -0.1%.
Wall Street whipsawed around on the back of the Fed meeting to close with decent gains. The S&P 500 was +0.3% higher in further all-time high territory at 3046. US futures are all but flat today, but Asian markets have been mixed today with the Nikkei +0.4% and Shanghai Composite -0.5%. In Europe there is a continuation of the mixed theme, with the DAX Futures +0.2% and FTSE 100 Futures flat.
In forex, we see USD continuing to weaken across the majors, with NZD and AUD main outperformers, along with GBP and EUR. Even the safe haven JPY is strengthening. In commodities, the dollar negative theme is helping too, with gold sustaining yesterday’s rebound, silver mildly higher and oil showing a solid degree of support.
There is a big focus on inflation on the economic calendar today. First up is the Eurozone flash inflation for October at 1000GMT. Headline HICP is expected to drop back to +0.7% (from the final +0.8% in September), whilst core HICP is expected to remain at +1.0% (+1.0% in September. The flash reading of Eurozone GDP for Q3 is also at 1000GMT which is expected to grow by a meagre +0.1% for Q3 leaving the year on year GDP down to +1.1% (from +1.2% in Q2). The Fed’s preferred inflation gauge, core Personal Consumption Expenditure for September is at 1330GMT. Core PCE is expected to slip further away from the 2% target, back again to +1.7% (from +1.8% in August). Weekly jobless claims are at 1230GMT, are expected to once more be around recent levels at 215,000 (212,000 last week).
Chart of the Day – AUD/USD
We spoke previously about a breakout on Aussie/Yen, and the outlook for the Aussie has continued to improve to an extent that AUD/USD has now broken through crucial resistance. The September high of $0.6895 marks the top of a three month trading range and this has now been broken. With the market having trended higher for the past four weeks, posting higher lows and higher highs, the candles have recently grown in magnitude of bullish strength, culminating in yesterday’s closing breakout. Momentum indicators are increasingly strong in configuration, whilst also showing further upside potential. The RSI is rising through the mid-60s, leading the breakout and at 12 month highs. Furthermore, MACD lines and Stochastics lines are also rising bullishly. It all suggests that near term weakness on the Aussie is now a chance to buy. The next technical test is the long term downtrend at $0.6940 today but there is something significant about this move building now. Given a 225 pip implied base pattern breakout the next resistance of note is at $0.7080. There is now a 50 pip bear term “buy zone” of support from the previous key high of $0.6895 and last week’s high of $0.6845.

It has been a choppy period of trading on EUR/USD but the bulls are emerging on top. Throughout this week we have been discussing the importance of the $1.1160/$1.1175 support and this has held in each of the past four sessions. The Fed meeting was a real test as it looked as though the dollar was strengthening to breach the support, however Fed chair Powell talk of the need for a “really substantial” increase in inflation for a rate hike saw the dollar sold off again. A whipsaw move drove EUR/USD to climb decisively into the close, forming a very strong bull candle. That is now the third bull candle in a row and the market is suddenly eyeing a test of the key October high at $1.1180. Momentum indicators have been teetering through the choppy trading this week but a swing higher on Stochastics, MACD lines still rising and RSI back above 60 is all positive. Despite it having been breached on an intraday basis, the four week uptrend (at $1.1110 today) is still a gauge of support, whilst the old $1.1100 breakout will also be key now for how intraday weakness is treated. The pair needs a closing breakout above $1.1180 to open $1.1250 and the way the bulls are winning recent sessions, we see weakness as a chance to buy now.

Political risk means that sterling has not reacted as positively to the Fed decision as the euro. Despite this, Cable has found enough support to see a third consecutive positive close. The most important takeaway from the past few sessions is that the support at $1.2785/$1.2820 is firming. Volatility on sterling has certainly dropped away in recent sessions and the question is whether this stability in the market will continue, we see no reason why not at this stage. For now, momentum indicators are looking settled and if anything lacking of direction, as the MACD and Stochastics plateau and RSI sustains between 60/70. A mild positive bias comes with the market having edged higher for the past three sessions and the lower high resistance at $1.2950 is the initial test for the bulls today. A breach would open the key October high around $1.3010. This positive bias is reflected in the hourly chart where the RSI is holding above mid-30s and pushing 70, whilst hourly MACD is above neutral. The post-Fed reaction low at $1.2840 is support of a higher low above $1.2785.

Is this a bull failure for the dollar? An intraday breakout above 109.00 was sold off into the close and the market formed a slightly bearish candle. However given the retreat over 40 pips back from what is another intraday spike high of 109.30, the bulls will be very wary now. There is still an uncertain feel to the market, but the momentum indicators are beginning to threaten to roll over now. There is no reversal as such yet but there is a feeling that the support band 108.50/108.70 needs to hold firm otherwise the selling pressure will gain momentum. The question now is how the bulls respond to the latest disappointment of failing to breakout. The hourly chart is taking a neutral configuration, but a negative bias is beginning to develop. Watch the daily Stochastics which are threatening a sell signal. Under 108.50 would reflect growing bear pressure, with 108.25 a key low and two month uptrend support at 107.90 today.

Gold
Anyone looking for clarity and direction on gold on the back of the Fed meeting will have been left scratching their heads. The initial stance of mild hawkishness from Powell dragged gold back to the $1480/$1481 support band, but when he talked of the need for really substantial inflation for a rate hike, gold swung back over a percent higher. Ultimately, all supports and resistance levels of note that we talked about prior to the Fed are still intact. The importance of $1480 is growing, whilst the market is back into the $1497/$1500 resistance area. Daily signals are again giving nothing on direction, and arguably even less than yesterday as the Stochastics again look to bottom. When a period of oscillation between 43/55 on RSI now stretched to four weeks, you know this is a market in consolidation. Broadly, gold needs a close above $1518 or below $1480 to suggest any realistic direction. Sitting bang in the middle of this today, we are no closer to finding it. The argument is that a tiny positive bias is now in the hourly configuration, but nothing of any conviction.

WTI Oil

The corrective move within the uptrend channel continued lower for a third straight session yesterday. This is now the point where the bulls need to show themselves again. A support band $54.60/$54.95 saw an intraday breach yesterday but in bouncing from $54.40 the market held the band into the close, whilst the channel support (rising today at $54.60) also held. The concern is that momentum indicators are rolling over as the Stochastics are weighed down after three negative candles in a row. There needs to be a reaction today and initially, the market is edging higher and again hanging on to the support band $54.60/$54.95. If this continues to hold, then playing the channel higher and buying into the weakness could emerge. A move above resistance at $55.75/$55.95 could be the catalyst for another swing higher.

As the dust settles in the wake of the FOMC decision, US equities pulled higher. An intraday slip on the Dow found support at 27,000 to close clear of recent resistance and at a five week high. The candlestick, being a bullish engulfing, is certainly positive for the near term outlook and the bulls will be eyeing the September high at 27,307 and the all-time high of 27,399. Momentum indicators are with the breakout, as RSI moves into the 60s and confirm the five week high. The outside day session now leaves 27,000 as a key near term marker as weakness is now a chance to buy. Hourly indicators show strength but also upside potential in the breakout. All the signals are now aligned for further gains to test the highs.
"""DISCLAIMER: This report does not constitute personal investment advice, nor does it take into account the individual financial circumstances or objectives of the clients who receive it. All information and research produced by Hantec Markets is intended to be general in nature; it does not constitute a recommendation or offer for the purchase or sale of any financial instrument, nor should it be construed as such.
All of the views or suggestions within this report are those solely and exclusively of the author, and accurately reflect his personal views about any and all of the subject instruments and are presented to the best of the author’s knowledge. Any person relying on this report to undertake trading does so entirely at his/her own risk and Hantec Markets does not accept any liability. """
