When:
29th January after US market close
Expectations:
Facebook (NASDAQ:FB) had an impressive 2019. Shares jumped 56% as investors cheered the tech giants’ strong revenue and earnings growth. Can Facebook keep growing? Or will coronavirus fears overshadow Facebook earnings.
What to watch:
1. Slowdown in revenue growth - After 29% revenue growth yoy in Q3 and 28% in Q2, CFO David Wehner has cautioned over Q4 warning that a “more pronounced deceleration of revenue growth in Q4” is expected. The consensus estimate is 23%.
2. Monthly Active Users – Despite intense regulatory scrutiny and the negative stories hitting the press, Facebook (NASDAQ:FB) users have not abandoned the platform in any significant way. Monthly Active Users are expected to grow 7%. However, it is worth paying attention to Facebook's’ family metric which aims to de-duplicate users across its services. Has this unique daily user number across Facebook’ group of apps increased in Q4?
3. Guidance – looking ahead Facebook (NASDAQ:FB) expects Q1 EPS to increase by 10% ad revenue by 23%. Investors will be watching for any changes to guidance.
4. Costs – 2020 will be a year of transition and costs will be in focus amid continued investment in safety, security and privacy as Facebook (NASDAQ:FB) comes under regulatory scrutiny. These expenses could rise in 2020 to between $54 billion - $59 billion. This would exceed 2019 costs, expected to be $46 billion - $48 billion.
Chart thought:
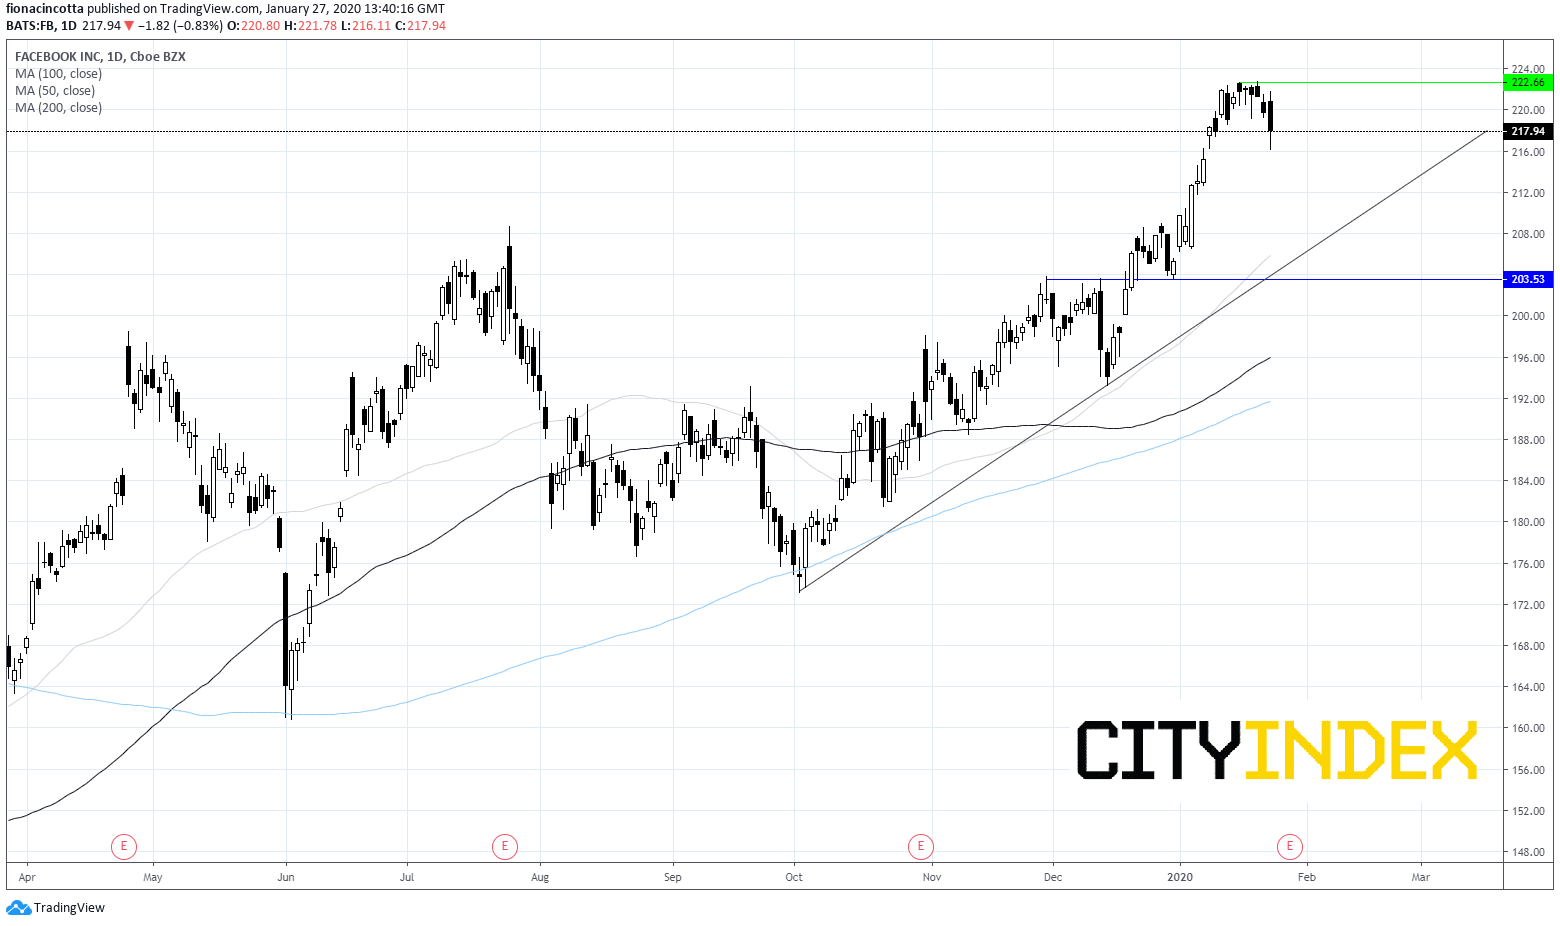
The Facebook (NASDAQ:FB) share price reached an all-time high of $222.75 Jan 22nd . The stock trades above its 50, 100 & 200 sma on a bullish chart.
Strong support can be seen at around $205/$203 with the 50 sma, the high (Dec 12th) and support from the ascending trend line. A break through this level could negate the current bullish trend.
On the flip side support can be seen at $222.66 and the all time high $222.75.

"Disclaimer: The information and opinions in this report are for general information use only and are not intended as an offer or solicitation with respect to the purchase or sale of any currency or CFD contract. All opinions and information contained in this report are subject to change without notice. This report has been prepared without regard to the specific investment objectives, financial situation and needs of any particular recipient.
Any references to historical price movements or levels is informational based on our analysis and we do not represent or warrant that any such movements or levels are likely to reoccur in the future. While the information contained herein was obtained from sources believed to be reliable, the author does not guarantee its accuracy or completeness, nor does the author assume any liability for any direct, indirect or consequential loss that may result from the reliance by any person upon any such information or opinions."
