Wall Street declined as the selloff in the tech sector picked up pace, though European stock markets have opened up in the green this morning. The DAX eased up from its 200-day SMA support – it's not traded below this since Nov 2020. The FTSE 100 is mildly higher around 7,050 and remains well within the 6-month range still, marking time. Index composition explains some of the relative performance of US vs European markets - higher oil prices was a positive in Europe at the start of trade, absence of mega-cap momentum tech working out to be a positive. More cyclical, more defensive, more value all doing the FTSE a bit of a favour today – it’s not participated in the ride up, so it’s not swept up in the payback.
The S&P 500 dipped below last week’s low at 4,288.52, hitting 4,278.94 at one point before paring losses to finish the day at 4,300, its weakest finish since July and it’s now down 6% from the all-time high and well below its 100-day SMA. The Nasdaq bore the brunt of the selling, declining more than 2% with Microsoft (NASDAQ:MSFT), Amazon (NASDAQ:AMZN), and Apple (NASDAQ:AAPL) all down 2-3%, and the index is 8% below its high.
Index composition is playing a big role here – the heavy tech weighting in the S&P 500 has built on itself, so when it sells off it pulls it down fast. This very large corner of the market drove the index higher over July and August and is paying it all back now. Interesting to see rates not doing anything – US 10-Year yields hovering under 1.5% still so this is a technical/momentum selling in equities rather than the bond market leading stocks by the hand; though expectations for higher inflation/higher rates has clearly been a factor in the initial trip-up.
Big tech under pressure but in particular Facebook (NASDAQ:FB) on mounting regulatory/reputational damage – FB shares fell on the whistle-blower reveal, which threatens to do some damage to the company’s already well tarnished reputation. We've been here before with FB and nothing has really stuck – but its Teflon character will be tested with these revelations. Twitter (NYSE:TWTR) and Snap (NYSE:SNAP) shares also fell in sympathy – regulators are coming for social media companies, mark it.
ARK Innovation ETF (NYSE:ARKK) took a pounding as the big-tech growth names were in the firing line, especially some of the more growthy-momentum names. The fund is now roughly 31% below its Feb all-time high.
Interesting to see just how far off their record highs some of the largest-cap stocks are now, roughly: Microsoft: -7%, Alphabet (NASDAQ:GOOGL): -9%, Apple: -11%, Tesla: -10% (though had a better day on Monday), Facebook: -15%, Amazon: -14%, Shopify (NYSE:SHOP): -20%, Twitter: -25%, Twilio (NYSE:TWLO): -30%, Peloton (NASDAQ:PTON): -50%, Zoom (NASDAQ:ZM): -56%.
Tesla shrugged off the trouble for big tech as a strong quarterly delivery report buoyed the stock and took it past $800 again the slow and steady grind higher off the Mar-May double bottom continues to find headroom. However, it closed well off the daily high at $781, up less than 1% for the session as the drag from the broader tech rout pulled it down.
We’re at a point where the pessimism over the supply chain problems is probably nearing a peak, and expectations for growth have washed out. Likewise we may be at peak inflation/stagflation fears – the reopening is apace. Cyclicals/value are not doing enough to compensate for what amounts to a pretty sizeable pullback for the tech sector now, but there could be room for this area of the market to rally again as the economic situation starts to feel like it could pick up. Still this selloff looks like it has a little further to run before the equilibrium is restored.
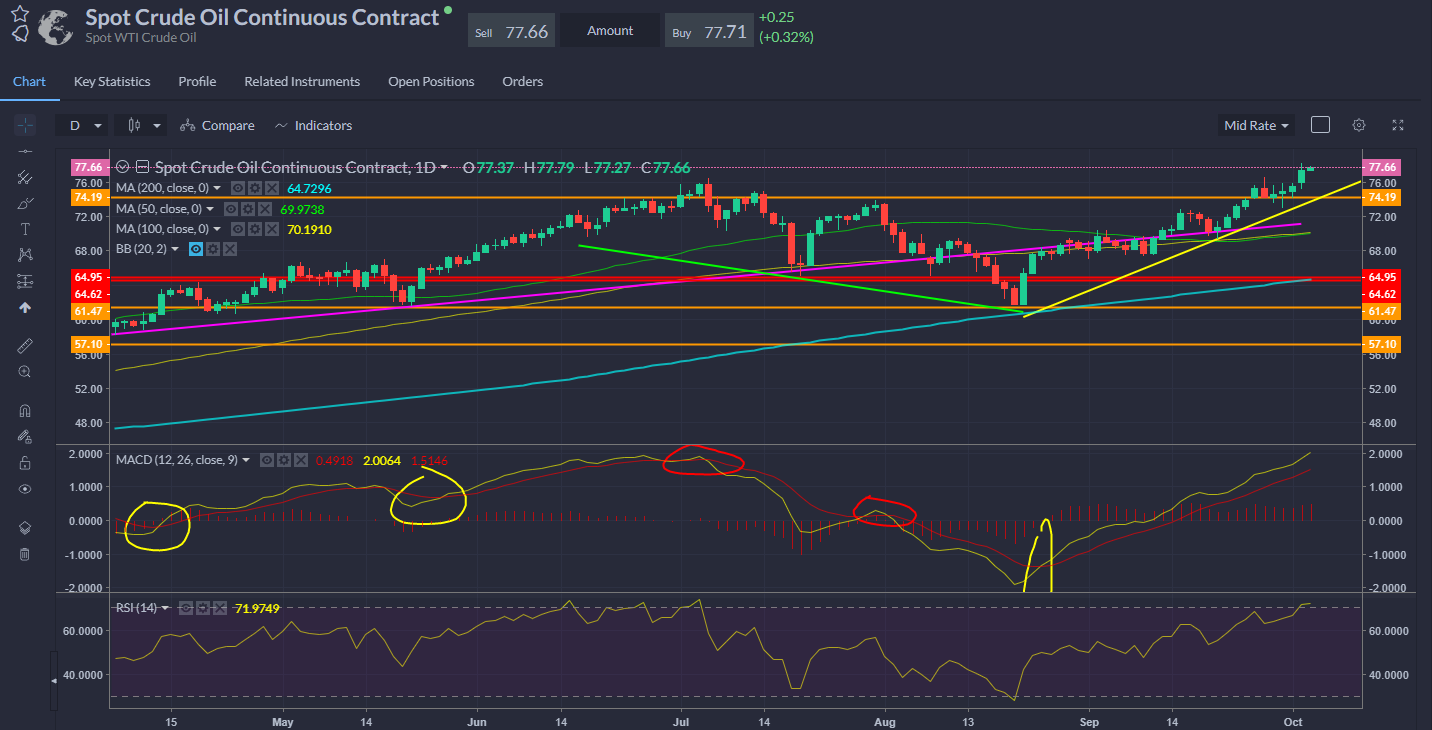
OPEC+ gave oil bulls a red rag to bid up futures contracts as it stuck to the planned increase in production for November at 400k bpd. Some had thought it could raise output a little more than the summer plan had set out, or frontload the increase in output in December by bringing into Nov (ie, 800k bpd in Nov), but the cartel stuck to the script. WTI and Brent both surged on the news and made a 7-year high. It’s not that demand is suddenly forecast to improve, it’s more that OPEC+ is keeping such a tight grip on supply and the US rig count just isn’t there to mop up excess demand. So, the market is going to be tight for a while yet – at least until well into 2022.
MACD crossovers still proving to be a sound indicator for oil trades. WTI now starting to look a little overbought.

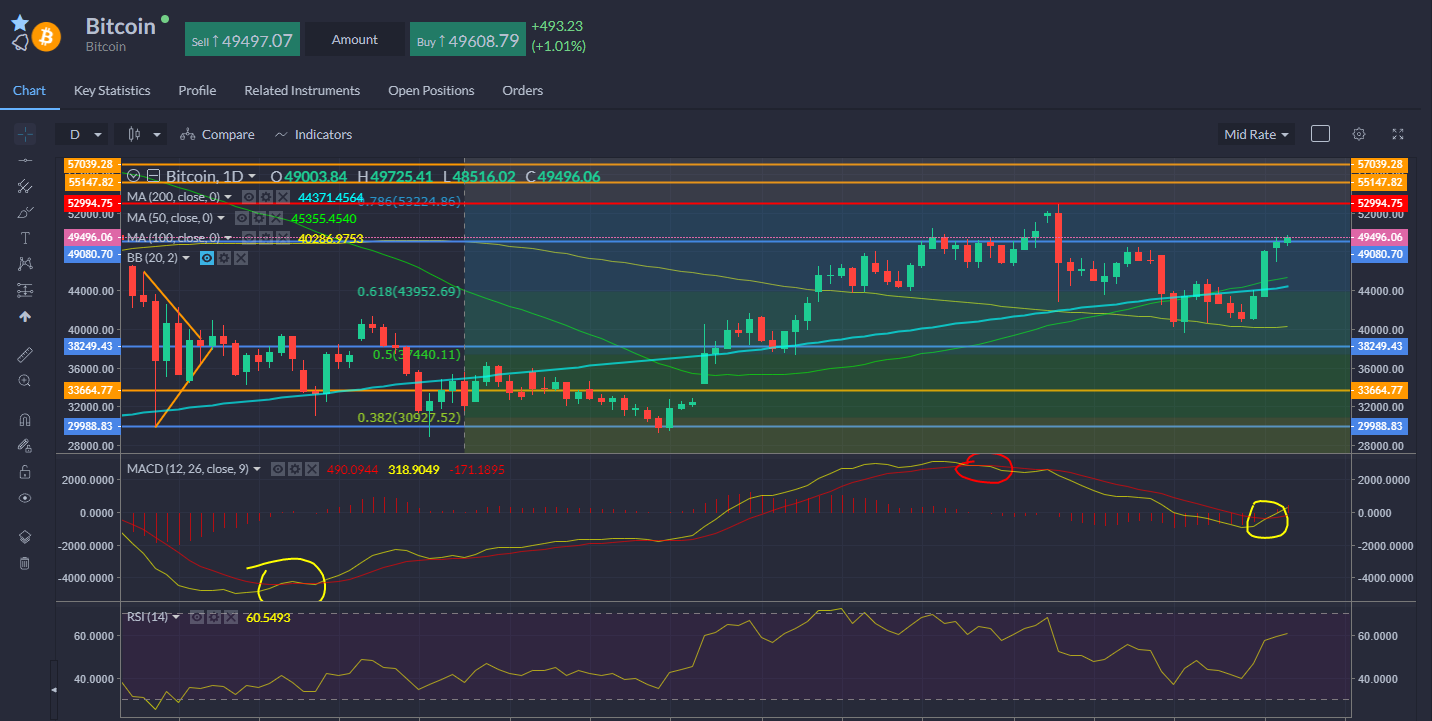
Elsewhere, Bitcoin moving higher again in the wake of the bullish MACD crossover – a generally solid indicator for the near-term trend. Looking for the recent swing high at $53,000.

