Ergomed (LON:ERGO) has released its full H121 results. H121 revenue numbers were included in the trading update in July 2021, while the full accounts released last week provided details on profits. In the trading update, management also guided that FY21 adjusted EBITDA would be materially ahead of market expectations, which has since been discounted in the share price, hence last week’s announcement delivered no surprises. However, the key takeaway for us was that overall operational momentum continues to be strong, including the first three months of H221 (following the already stellar performance in FY20). In H121, Ergomed has also launched its expansion into the Japanese market. We have slightly increased our valuation to £751m or 1,536p/share (from 1,445p/share).

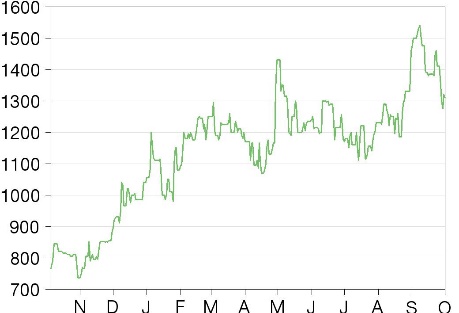
Share price performance

FX headwinds, but strong underlying growth
H121 results were substantially affected by FX headwinds, reflecting the increasing US$ contribution (now c 63% of the mix) after the US-based MedSource acquisition in December 2020. Total revenues increased to £56.0m, up 48.1% on constant exchange rate basis (CER; 38.8% reported) y-o-y. Like-for-like (excluding MedSource) total service fees (revenues excluding costs that are reimbursed by clients) grew 18.2% CER (11.1% reported). Including the acquisition, total service fees were £47.6m, up 37.7% CER (29.3% reported). Growth was driven by a solid order book (£227.8m, up 51% y-o-y) and healthy new business wins in H121 (£90.8m, up 50.8% y-o-y). This provides high visibility for H221 and into 2022.
Margins also ‘masked’ by unfavourable FX rates
H121 gross profit increased to £23.0m, up 24.3% from H120. The total gross margin contraction to 41.1% from 45.8% was partially expected due to increased presence and personnel in the US after the MedSource acquisition in December 2020, but also due to FX headwinds. However, the underlying total service fee gross margin on CER basis was a healthy 48.2% in H121 versus 50.1% a year ago. Adjusted EBITDA increased to £12.1m, up 33% from H120 (£9.1m), while adjusted EPS was 16.8p, up 48.7% from H120 (11.3p).
Valuation: £751m or 1,536p/share
We keep our FY21 estimates unchanged and modestly increase our EBITDA forecasts starting from 2022 based on improved margins, cost control and integration synergies. After rolling our DCF model forward, our valuation has increased slightly to £751m or 1,536p/share. This implies an EV/EBITDA multiple of 30.0x (FY21e). Ergomed trades at a modest premium on EV/EBITDA of 25.5x vs the peer average of 24.2x, but at a discount to Medpace on 31.8x. Flexing our DCF assumptions (long-term sales growth and profit margins), our bull case stands at 2,086p/share and our bear case at 1,072p/share (details in our Outlook report).
H121 update: Operational momentum continues
PrimeVigilance: Expanding to Japan
H121 revenues in the PrimeVigilance segment increased to £28.8m, up 16.2% CER (10.3% reported) y-o-y. Gross margin was largely flat at 50.7% versus 51.3% last year. One notable development in H121 was the launch of the expansion process in Japan. The Japan office is now fully operational, with local pharmacovigilance experts providing fully integrated PV services.
Clearly, the Japanese market has unique characteristics and, as a developed country, no shortage of competitors. Ergomed has been subcontracting some work in Japan, but will now have a local presence. During the analyst call, management explained that due to the nature of its business, Ergomed can compete with local PV players from now. To compete in the CRO market, it will likely need to acquire a local player.
H121 revenues from Asia were £3.3m (versus total revenues of £56.0m). Japan is the fourth largest pharmaceutical market in the world, so even moderate success in this region could translate into a meaningful addition to sales. We believe management might try to emulate the successful expansion in the US. As recently as FY19, the US made up 27% of the total revenue mix, while after two acquisitions in both business segments (CRO and PV) over the course of 2020 (and organic growth), the US now represents 63% of the mix.
CRO: Strong post-pandemic rebound continues
Ergomed’s total CRO revenues in H120 increased to £27.2m, up 106.4% CER (or 90.2% reported). Like-for-like (excluding MedSource) revenues increased to £16.6m, up 24.5% CER (16.1% reported). MedSource’s performance during the first full half-year after acquisition was described as good. Furthermore, the parties agreed to accelerate the earnout agreed during the takeover in December 2020. Ergomed will make the final payment of $3.8m (£2.7m) to MedSource shareholders in Q321, which will allow it to complete the integration.
For the near term CRO outlook, the company envisages few, if any, disruptions like those experienced last winter (due to the nature of the business, PV delivered a solid performance despite the pandemic). Ergomed is now also involved in a number of COVID-19 projects in its CRO and PV businesses, which could act as a mitigating factor in the case of potential disruptions this winter, or as a boost to performance (albeit no financial details about the size of COVID-19-related work were provided).
Estimate changes and near-term catalysts
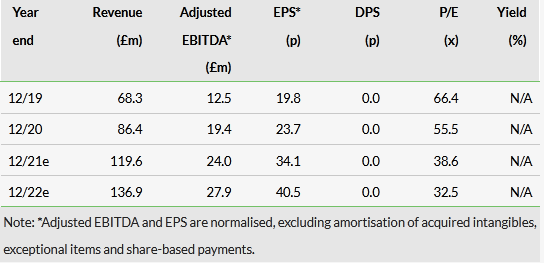
Following the H121 results, we keep our FY21 estimates unchanged. In FY22 we slightly increased adjusted EBITDA margin by reducing SG&A costs to reflect Ergomed/MedSource synergies that we believe could be achieved sooner than we thought now that the integration is complete (Exhibit 1). Our total FY21, FY22 and FY23 revenue estimates are unchanged at £119.6m, £136.8m and £161.3m, respectively. Our FY22 adjusted EBITDA margin improved slightly to 20.4% (from 19.8%). Our adjusted EBITDA estimates are £24.0m for FY21 (unchanged) and £27.9m for FY22 (vs £27.1m previously).
Net cash was £24.6m at end-H121 versus £19.0m at end-FY20. Ergomed continues to be debt free, but still has access to facilities of £30m. The near-term catalysts are as follows:
- Bolt-on acquisitions: the strong balance sheet and access to debt (£30m facility available) position Ergomed very well to consider further inorganic growth opportunities.
- A reverse in US$/£ rate could lead to an unexpected positive catalyst and continued weakness would mean further headwinds now that the US has become a major market.
- Next trading update is expected in January 2022.
Click on the PDF below to read the full report:
