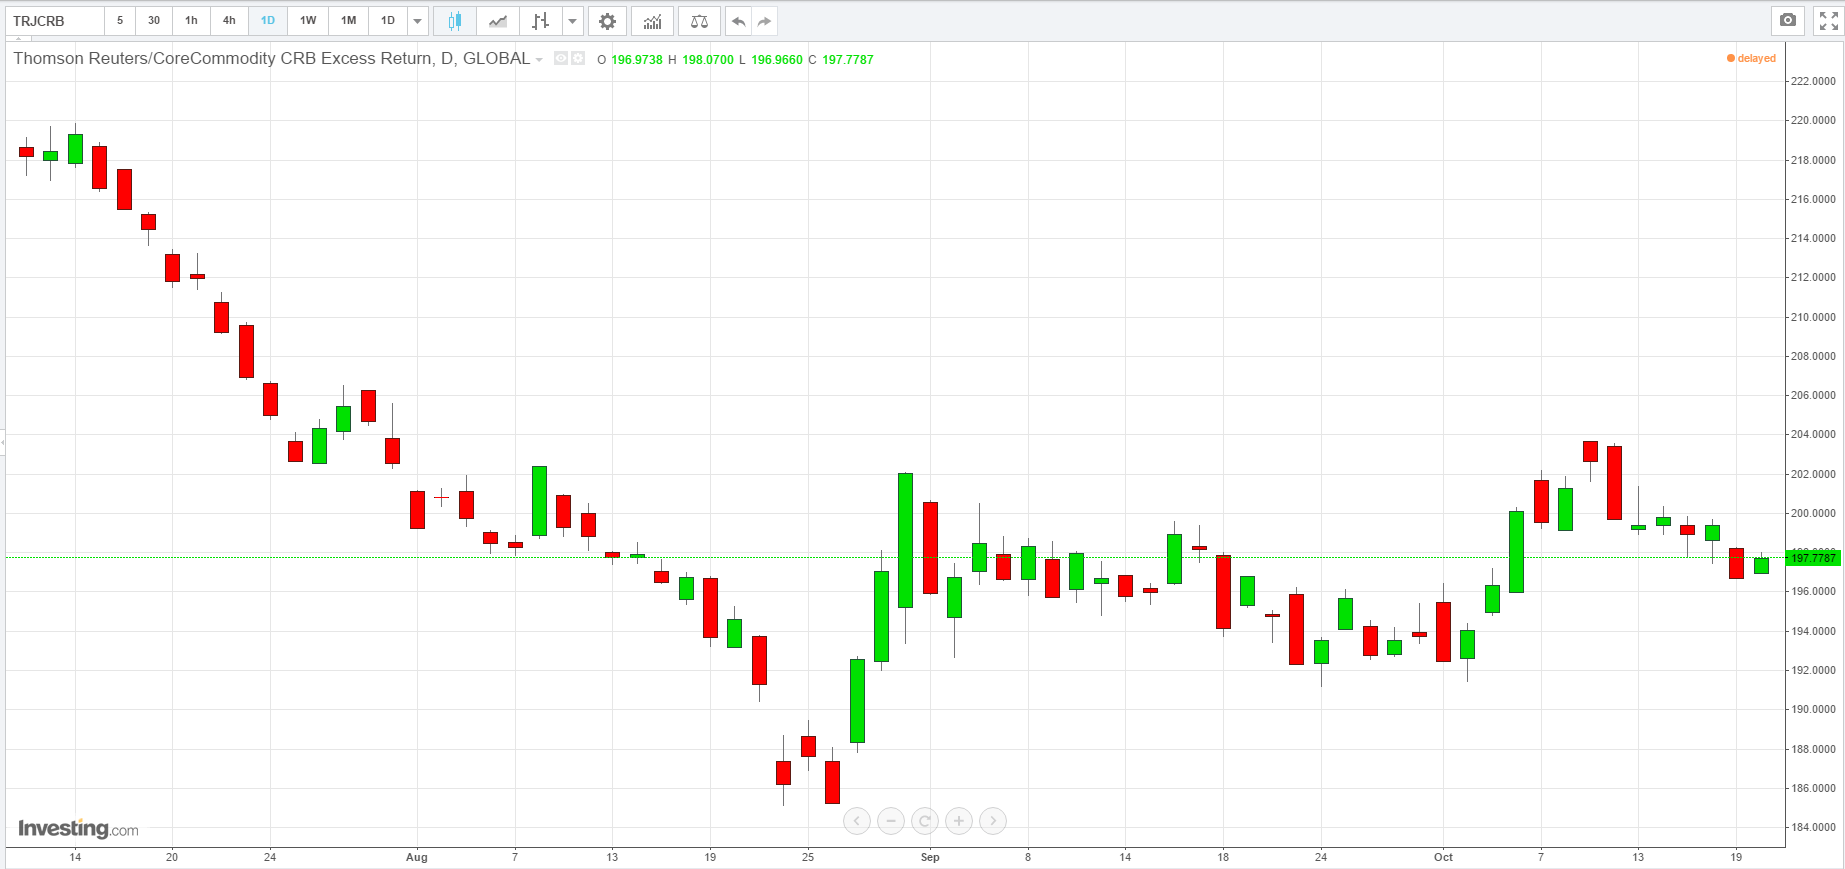
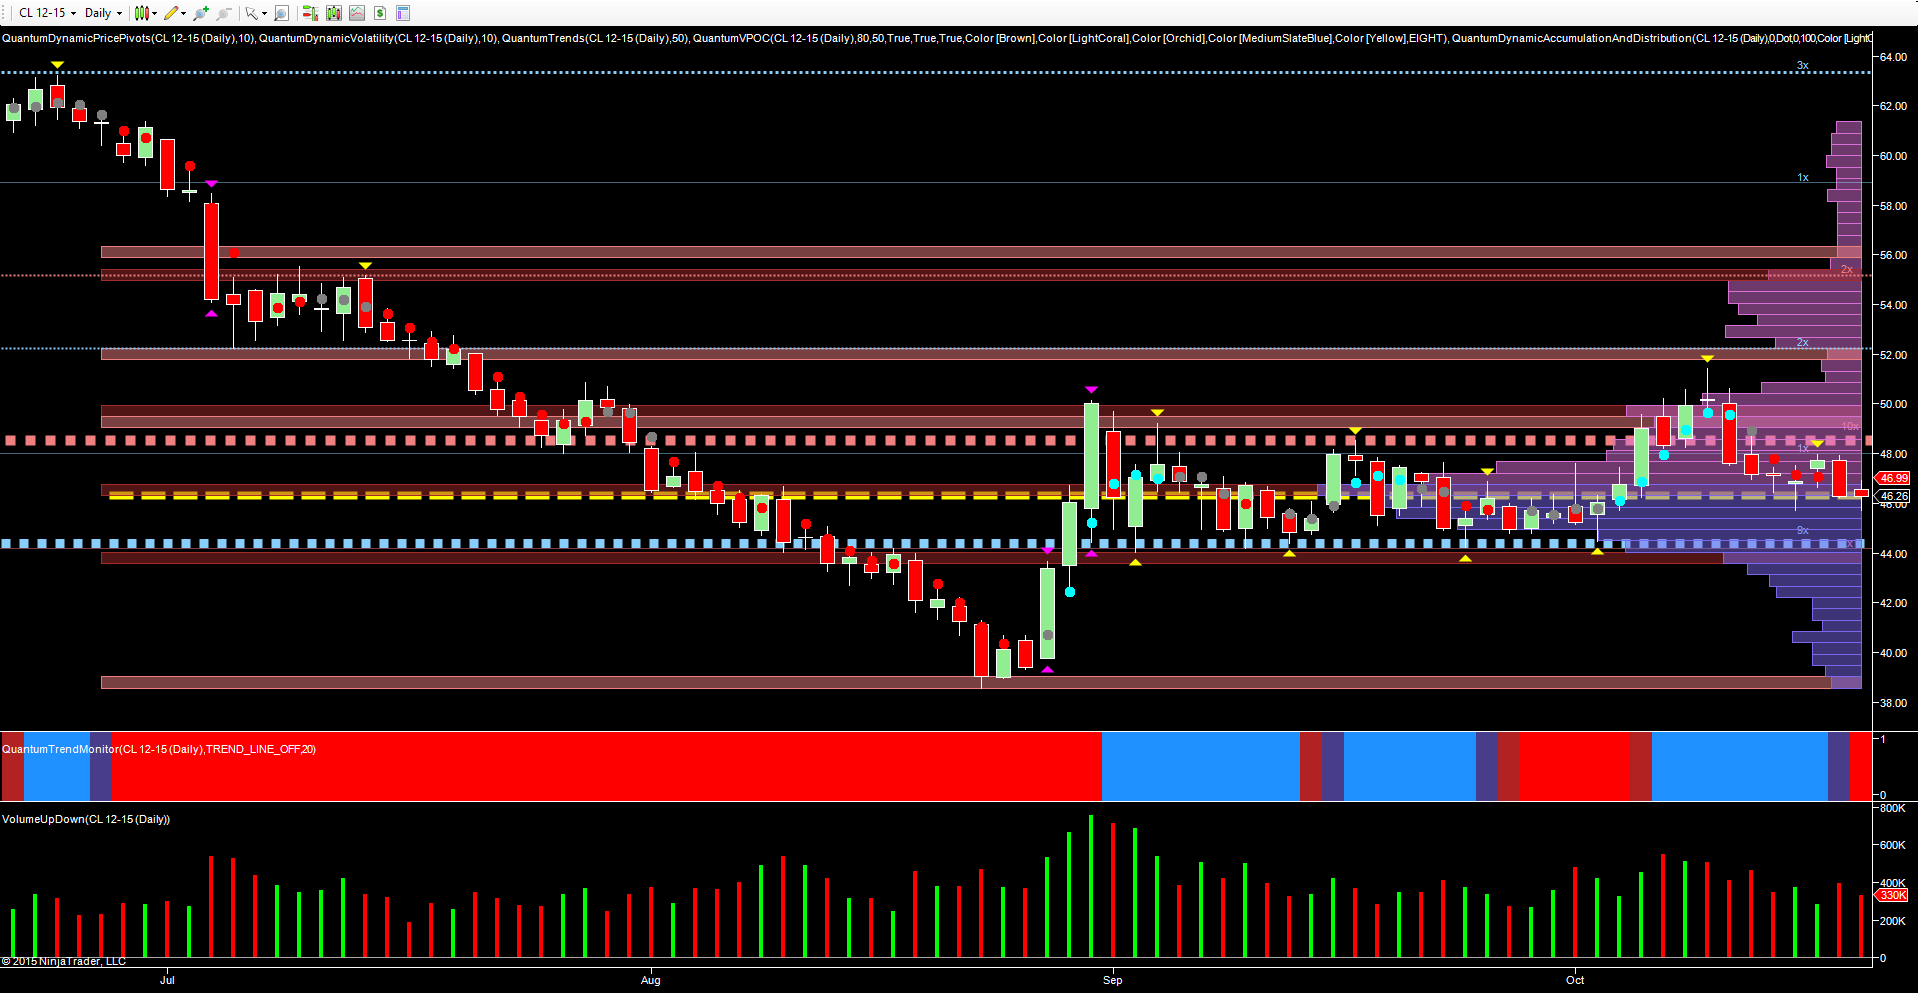
If you were wondering where oil was heading next,longer term and wanted an alternative view for the commodity then the CRB index is certainly one place to start, with the daily chart reflecting and mirroring the current technical picture for oil. The long bearish trend for commodities in general and oil in particular finally came to an end in late August as the shakeout in equities triggered an equally violent reaction from crude oil, with the CRB rising dramatically over three days to retest the 202 region on the daily chart. Since then the index has returned to trade within the range of this price action while briefly suggesting a further move higher as the 204 region was approached two weeks ago (before bearish sentiment returned driving the index lower and back below the psychological 200 level to trade at 197.80, at the time of writing). The chart itself is a carbon copy of the November CL contract, as we can see from the chart the key levels are extremely well defined in this timeframe, with the VPOC (volume point of control) indicator once again taking centre stage. Not only is the yellow dotted line the fulcrum of price agreement at present, but it also confirms the deepest area of price congestion in the current timeframe. The VPOC is where price, volume and time have converged to develop the current histogram to the right of the chart, as well as signaling a number of significant technical factors.
First, the current price action is still contained within the candle created on August 31, a wide spread-up candle but one that moved well outside the average true range, as denoted by the volatility indicator. This in itself suggested a trap move with the price action moving back inside the spread of the candle and continuing to remain rangebound throughout September, and for much of October.
Shifting Sentiment
Second, the VPOC itself was marooned for some time in the $60-per-barrel range on this timeframe and confirmed the heavily bearish tone for oil. But with the subsequent move lower to the $46 per barrel area, this confirms that sentiment has shifted with price agreement now settled at this lower level.
Finally, the areas of price resistance and support are now clearly defined, with the floor of potential support denoted with the blue dotted line in the $44 per-barrel area, while to the upside, resistance overhead awaits in the $48.50 per-barrel area, with a further region at the high volume node at $50 per barrel. Given the proximity of the price action to the VPOC -- coupled with the tight trading range -- for longer term oil investors and speculators from technical perspective, it’s a question of being patient and waiting for the break away from this region. If the platform of support in the $44 per-barrel area fails to hold, then we are likely to see a return to test the $39 per-barrel region last seen in late August. For any move to the upside, volume holds the key. But with buyers thin on the ground at present, any move to take out the October 9 high of $51.42 will need to be on rising and above-average volume for any longer-term trend to develop and gain traction.
From a fundamental perspective, recent weakness in the US dollar has done little to help move oil prices higher, and with OPEC (primarily Saudi Arabia) continuing to maintain its position of taking on the alternative energy suppliers, then supply is likely to remain controlled for the time being. For the shale oil industry the key price levels likely to impact their operation are $50 per barrel for high-cost production regions such as the North Sea. But for US producers, oil needs to fall to $30 per barrel before that industry becomes uneconomic.
Finally, it is against this backdrop that a number of oil producers including Russia have been invited to Wednesday’s OPEC meeting in Vienna where the current high-stakes strategy of taking on the alternative suppliers will be discussed and debated.


