
This article was written exclusively for Investing.com.
- The bullish baton passes to cotton
- The 2011 high was unsustainable
- $1 cotton during the offseason
- The latest WASDE report was bullish
- BAL is the cotton ETN product
The cotton futures market had been trending higher since early April 2020 when it reached rock bottom at 48.35 cents per pound, the lowest price in over a decade since 2009. Cotton futures recovered and rose above 50 cents by the end of April 2020. In June, the fluffy fiber eclipsed the 60 cents level, and in October and November 2020, the 70 cents level gave way to higher prices.
In January 2021, cotton futures rose above 80 cents leading to a move over 90 cents in February. After consolidating between just below 80 cents and just above 90 cents from February through August, it looked like cotton hit an upside wall on Sept. 20 when the price took an elevator lower. The active month December futures contract plunged from 92.42 to a low of 88.95 cents on the day the stock market ran into a bout of selling. The total number of open long and short positions in the cotton futures arena fell from 272,703 to under 263,000 contracts as some speculative longs scrambled for an exit.
The cotton correction turned out to be a one-day wonder as the price surged, moving over the $1 per pound level for the first time since 2011 in late September.
The bullish baton passes to cotton
Over the past months, the other soft commodities rose to multi-year highs. Coffee futures moved to the highest price since February 2014 in July when coffee eclipsed the $2 per pound level. Nearby sugar futures moved to the highest level since February 2017 in August when the sweet commodity traded above 20 cents per pound. Orange Juice futures reached the highest price since October 2018, when they traded at $1.48 per pound in September. Even nearby cocoa futures made a new high for 2021 last week.
ICE cotton futures experienced the most dramatic move.
Source: CQG
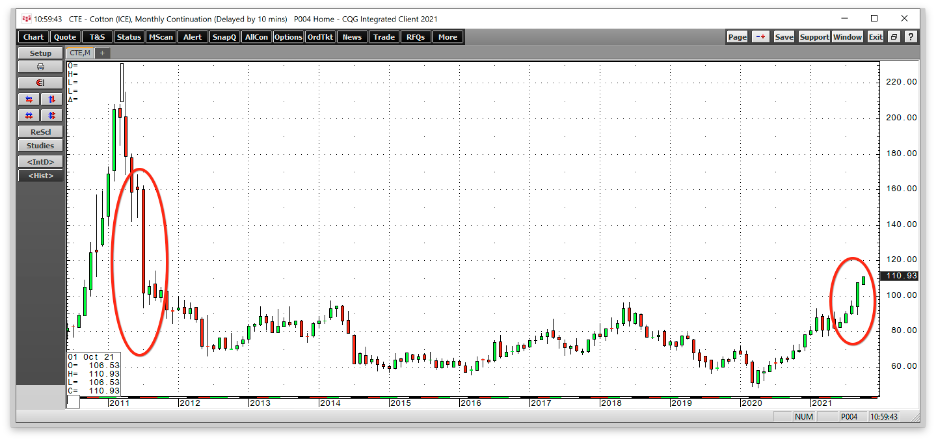
As the chart highlights, nearly cotton futures exploded to the most recent high of over $1.10 per pound, a level not seen in a decade since 2011.
The 2011 high was unsustainable
In 2011, cotton reached an all-time high at $2.27 per pound. During the global financial crisis in 2008, the price fell to a low of 36.70 cents before exploding higher and peaking in 2011.

Source: CQG
The chart illustrates the move that took cotton futures eight and one-half times higher from the 2008 lows to the 2011 high. A price over $2 proved unsustainable as producers increased output, pushing the price below the $1 level in 2011. Cotton futures had not traded above $1 from late 2011 through late September 2021.
$1 cotton during the offseason
Cotton tends to rally during the spring as uncertainty over the annual crop reaches a peak. In late 2021, cotton is exploding higher on the back of pent-up demand in the wake of the coronavirus and ongoing supply chain issues. China is importing cotton from the US, making goods, and shipping them back to the US as demand for clothing has been rising. According to the US Department of Agriculture, US export sales of cotton to China since Aug. 1 surged 83% on a year-on-year basis. The post-pandemic demand surge for consumer goods has caused the USDA to project Chinese cotton consumption for the current marketing year to be 41 million bales, 24% higher than over the past two marketing years.
The latest WASDE report was bullish
The latest USDA World Agricultural Supply and Demand Estimates report was bullish for the cotton market. On Sept. 10, the USDA said:
“Beginning stocks are slightly lower than last month in the 2021/22 US cotton estimates, but a much larger increase in production means that both exports and ending stocks are higher than estimated in August. US cotton production is forecast at 18.5 million bales, up 1.2 million bales despite a 4 percent decline in harvested area, largely due to increased projected yields in Texas. With both world trade and US supplies higher this month, US exports are 500,000 bales higher and ending stocks are 700,000 bales higher. A higher season average farm price for upland cotton is also expected, up 4 cents per pound from last month to 84 cents. World 2021/22 cotton ending stocks are 540,000 bales lower this month as a 1.4-million-bale world consumption increase spread over 2021/22 and the year before more than offsets a 750,000-bale increase in 2021/22 world production. Consumption is projected higher in both years for Pakistan, Bangladesh, Brazil, and several smaller countries. Turkey’s consumption was also increased 100,000 bales for 2021/22, and Vietnam’s lowered by the same amount due to recent problems with COVID-19. World 2021/22 production is higher this month as increases for the United States, Australia, and Argentina offset declines in India, Greece, and several countries in West Africa’s Franc Zone. World trade in 2021/22 is still projected down from the previous year’s record 48.5 million bales, but is projected 500,000 bales higher than in August, at 46.8 million bales.”
Source: USDA September WASDE report
The monthly WASDE report is the gold standard for fundamental data. The USDA said that US stocks edged lower, but an increase in output pushed ending US inventories higher. Meanwhile, rising worldwide consumption sent 2021/2022 global ending inventories 540,000 bales lower. The cotton market initially experienced selling after the Sept. 10 report, but the move under 90 cents became a launchpad for a move to a decade high. 
Source: CQG
The daily chart shows cotton futures moved to a low of 88.95 cents per pound on Sept.20, ten days after the latest WASDE report. On Sept. 20, markets across all asset classes experienced selling. Meanwhile, the correction ended quickly, and cotton exploded to its latest high at $1.1393 per pound on Oct. 6, 28.08% higher than the Sept. 20 low.
BAL is the cotton ETN product
The most direct route for a risk position in the cotton arena is via the futures on the Intercontinental Exchange. The iPath Cotton Subindex ETN product (NYSE:BAL) provides market participants an alternative to the futures market. BAL has $13.484 million in assets under management and trades an average of 11,031 shares each day. The ETN charges a 0.45% management fee. Cotton futures rallied by just over 28% from the Sept. 20 low to the most recent high on Oct. 6. 
Source: Barchart
Over the same period, BAL rose from $48.95 to $63.95 per share or 30.6%, as the ETN did an excellent job tracking the cotton futures market.
Bull markets tend to move much higher than logic, reason, and rational analysis suggests possible. We witnessed an irrational move in 2011 that took the price to $2.27 per pound. At the 2011 high, garment manufacturers turned to synthetic fibers to produce products as cotton’s price became prohibitive. Cotton will eventually reach a peak, but the current trend remains a bullish freight train.