
Global stocks are pointing higher on Tuesday morning as a boost from China improves sentiment. A benchmark of Chinese stocks was up over 5.5% after People's Bank of China (PBOC) Governor Pan Gongsheng announced plans to lower borrowing costs and allow banks to increase their lending. The move comes after growing concerns that the world’s second largest economy could miss its growth targets this year after a series of economic data prints.
China A50 daily chart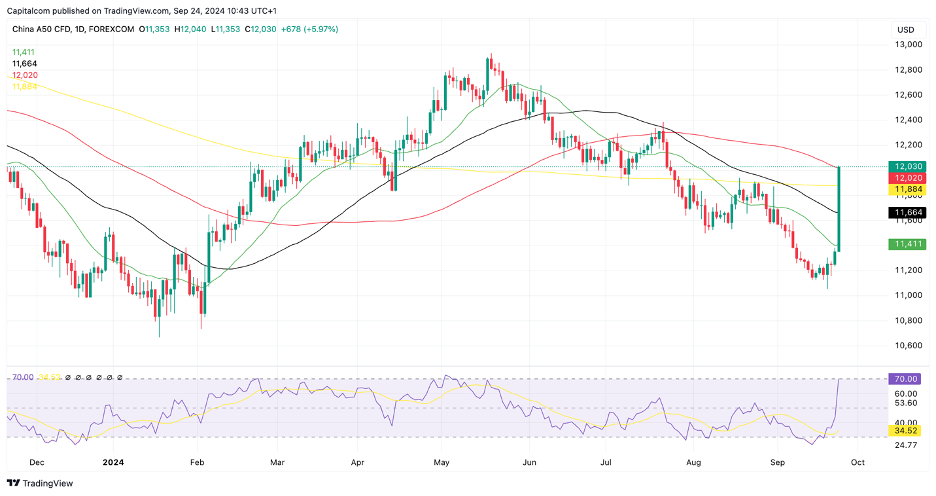
Past performance is not a reliable indicator of future results.
The lacklustre data had been weighing on sentiment not only in Asia but also on those areas with large exposures to the Chinese economy. Copper prices, which are often used as a barometer of overall economic sentient, have responded positively to the stimulus news, currently up 2.3% during the European session.
Copper daily chart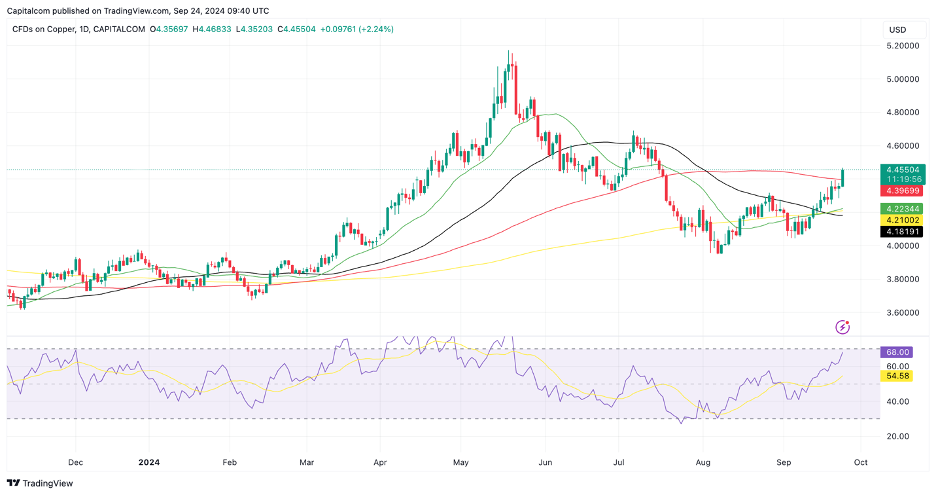
Past performance is not a reliable indicator of future results.
But the positive sentiment may not last as some fear the stimulus may have come too late. With a crumbling property market and lacklustre consumption rates may need to come down lower to boost confidence in the region. Further fiscal stimulus could see a stronger rebound in Asian markets.
Meanwhile, European stocks have attempted to capitalise on the positive sentiment stemming from Asia but there has been some resistance as the morning has moved along. There seems to be this feeling of lack of direction in many major equity indices in Europe right now, with investors looking for the next motive to push higher after ECB rate cuts have already been priced in for the year.
The EU STOXX 600 has started to approach a key area of resistance which has been in play for the past four months. Today’s candlestick has so far failed to penetrate this area, having pulled back slightly from the highs at the time of writing. This validates the notion of continued resistance suggesting we could see the index remain under pressure over the coming days, waiting to see how global sentiment evolves at a time when the economic calendar is relatively quiet.
At this point, a break above 522.45 could cement the bullish appetite higher, especially if the RSI mimics the move higher. Beyond this, there has been a fair amount of resistance between 523.60 and 525.50 before reaching the all-time high at 526.66 seen on August 31.
EU STOXX 600 daily chart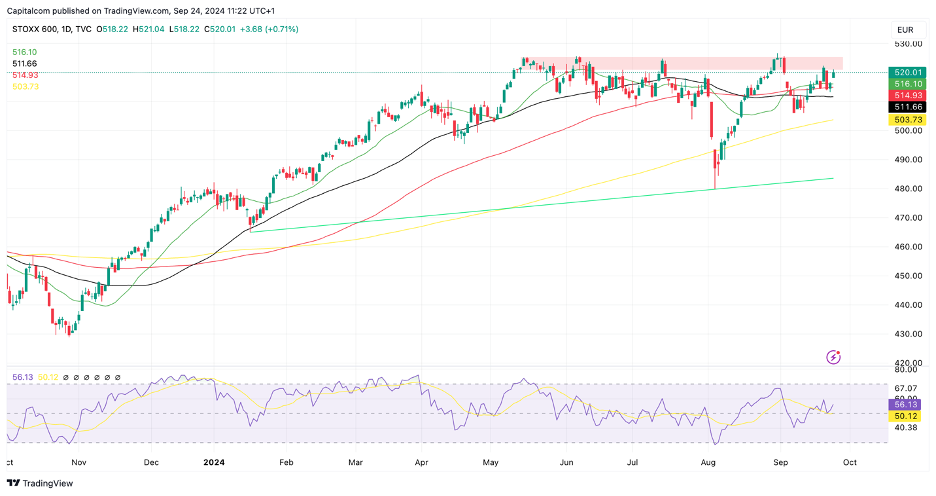
Past performance is not a reliable indicator of future results.
Disclaimer: This is for information and learning purposes only. The information provided does not constitute investment advice nor take into account the individual financial circumstances or objectives of any investor. Any information that may be provided relating to past performance is not a reliable indicator of future results or performance. Social media channels are not relevant for UK residents.
Which stock should you buy in your very next trade?
AI computing powers are changing the stock market. Investing.com's ProPicks AI includes 6 winning stock portfolios chosen by our advanced AI. In 2024 alone, ProPicks AI identified 2 stocks that surged over 150%, 4 additional stocks that leaped over 30%, and 3 more that climbed over 25%. Which stock will be the next to soar?
Unlock ProPicks AI