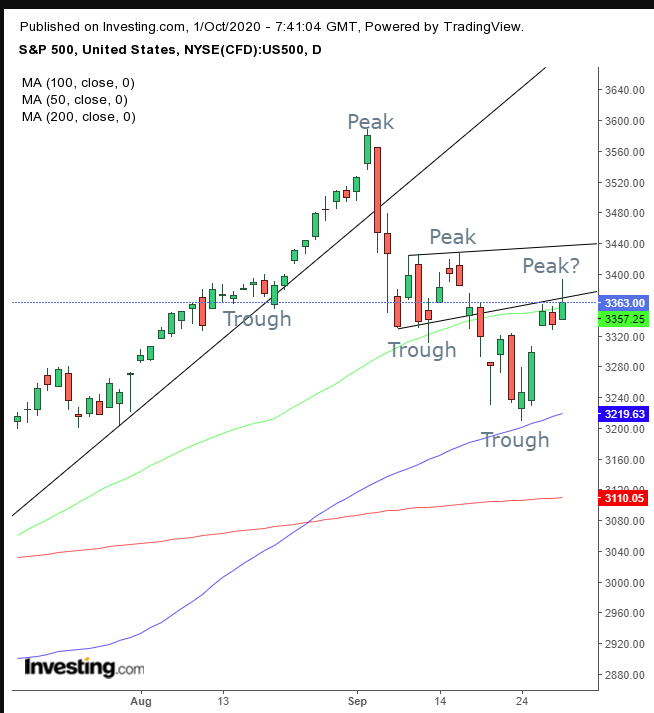
As September came to a close, the S&P 500 Index locked in a 4.7% loss for the month, its worst decline for the same period since 2015, when the index shed 5.1% of value. However, when the benchmark fell to its 3,209.45 low—exactly one week ago—it was down as much as 8.3%, on track then to provide the worst results since the 8.6% losses on September 2011.
An abrupt realization by investors that mega cap tech stocks were overvalued, triggering a comparison to the dotcom bubble, sent high-flying tech shares lower, weighing on the broader index. However, the very same technology companies that dragged benchmarks into a rout were suddenly bargains at their lower levels, which seemed to justify driving prices up again. Adding to the market pressure, on-again, off-again hopes of additional US pandemic economic relief, chances of which today appear once again optimistic.
However, while the S&P 500 did climb for the fourth day out of five yesterday, the widely-followed benchmark did close well off its high after Mnuchin said there had not yet been a final agreement hammered out.
Trader consensus, however, isn't projecting optimism this deal will actually come to fruition. Technicals projected by the price and its trading pattern indicate the index is heading lower.

As mentioned above, yesterday’s advance finished well off intraday highs. It did so after attempting to breach a rising flag, bearish after the 7% plunge in just three sessions from Sept. 3-8. Yesterday was the third day in which the price fell away from the bottom of this bearish pattern.
The 50 DMA joining the flag’s bottom underscores it's a technical pressure-point, where supply and demand meet. Wednesday’s trading pattern developed a shooting star, a candlestick with a long upper shadow, charting how bears drove bulls back, a bearish indicator.
Combined, all this increases the odds that the current rally is losing momentum. Market mechanics—a return move following a breakout, after the first explosive drop, as demand dried out within the continuation pattern—let supply crash when sellers raced to find new willing buyers, at lower prices. The return-move was presumably fueled by a short, along with short-term dip buyers, compounded by hopeful bulls.
Now that the move's technicals have been cleared out, the resistance on the very bottom of the flag suggests positions will continue to roll along the market dynamics, perhaps prematurely pricing-in the ever illusive stimulus package.
Trading Strategies – Short Position
Conservative traders would wait on a short, for another trough, establishing a downward peak-trough formation, independent of the prior uptrend.
Moderate traders may risk a short with a close below the present week's price cluster, which would indicate that demand has run out, letting supply crash lower.
Aggressive traders would short right now, after bulls failed yesterday to take on the flag, even after piercing it on an intraday basis, sending them into a retreat, providing they have a trading plan that they will follow. Here’s an example:
Trade Sample
- Entry: 3,365
- Stop-Loss: 3,400
- Risk: 35 points
- Target: 3,225
- Reward: 140
- Risk:Reward Ratio: 1:4
