This article was written exclusively for Investing.com
After falling sharply throughout the week, the dollar has found some short-covering support, and this has taken some shine off precious metals at the start of Friday’s session. However, I believe Gold and in particular Silver are not done just yet and more gains could be on the way before the year is out.
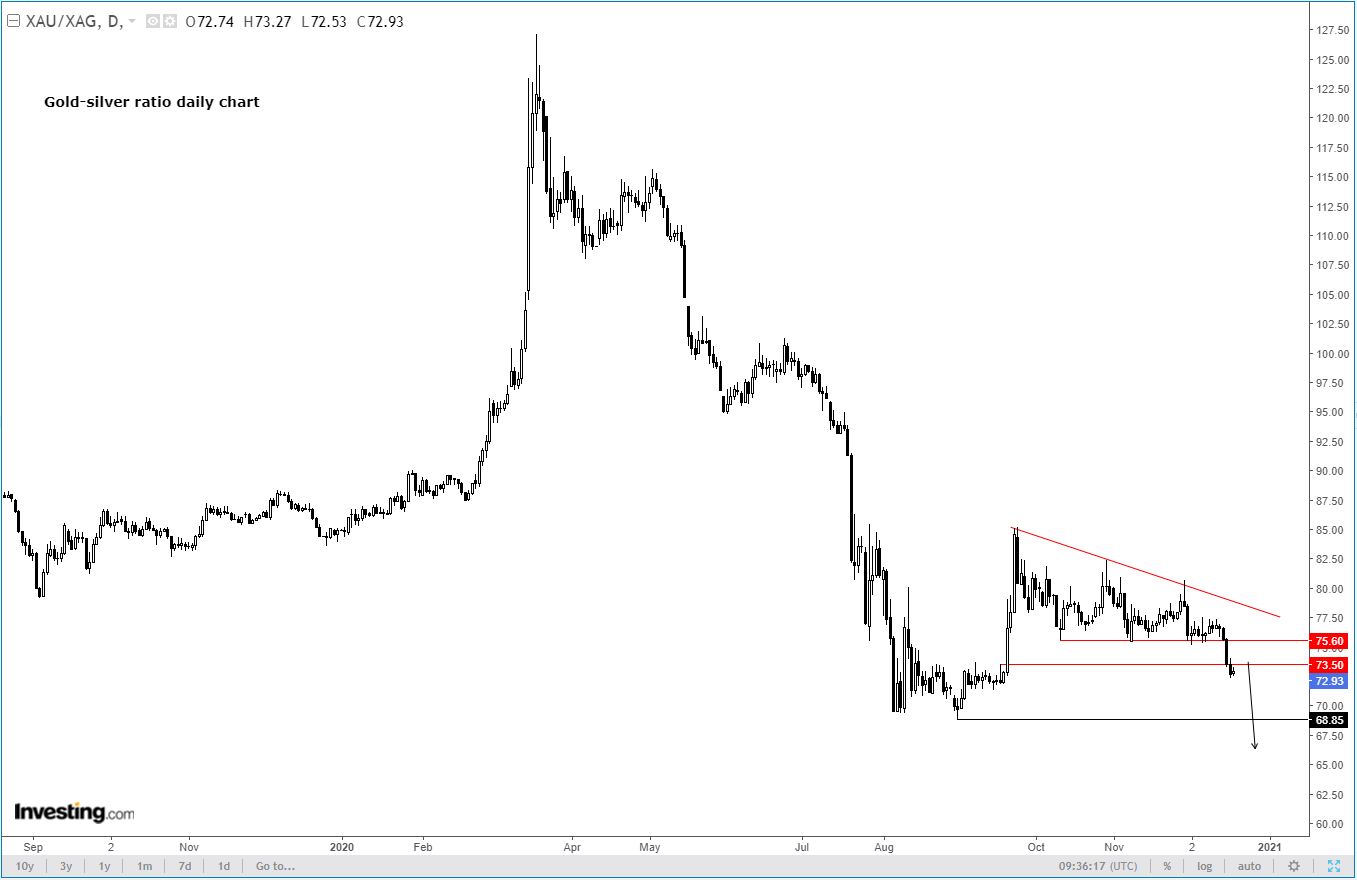
Silver is looking particularly strong compared to other precious metal, given a falling gold-silver ratio:

As the chart shows, gold has been underperforming silver since March and recently the ratio broke down again from a consolidation phase to ignite fresh flows into silver. As things stand therefore, the gold-silver ratio chart looks set to fall to at least below the recent low of 68.85, meaning that there should be further outperformance from silver in the days ahead.
Now outperformance could mean two things: silver rising faster than gold or falling at a slower pace compared to the yellow metal. But judging by recent price action on both metals, not to mention the dollar’s accelerating downtrend, silver is likely to rise further over time in my view.
In the slightly longer-term outlook, gold and silver should continue to receive tailwind support from the ongoing flood of cheap central bank money. Meanwhile, the global economy is expected to recover with the rollout of COVID-19 vaccines which should help to boost industrial demand for silver (and base metals). Granted, supply restrictions will also ease and as prices rise, production increases should be expected. But I feel there is more room to the upside for silver than the markets have currently priced in.
One key factor that could drive silver higher is the fact many developed, and some developing countries, are moving towards cleaner energy and away from fossil fuels for their energy needs. Silver is used in solar panels, so it is natural to think that there will be growing demand for the metal, as well as copper—the latter is a key component in the construction industry, as well as clean energy, with wind, solar, batteries and electric cars all using the metal in electric wiring.
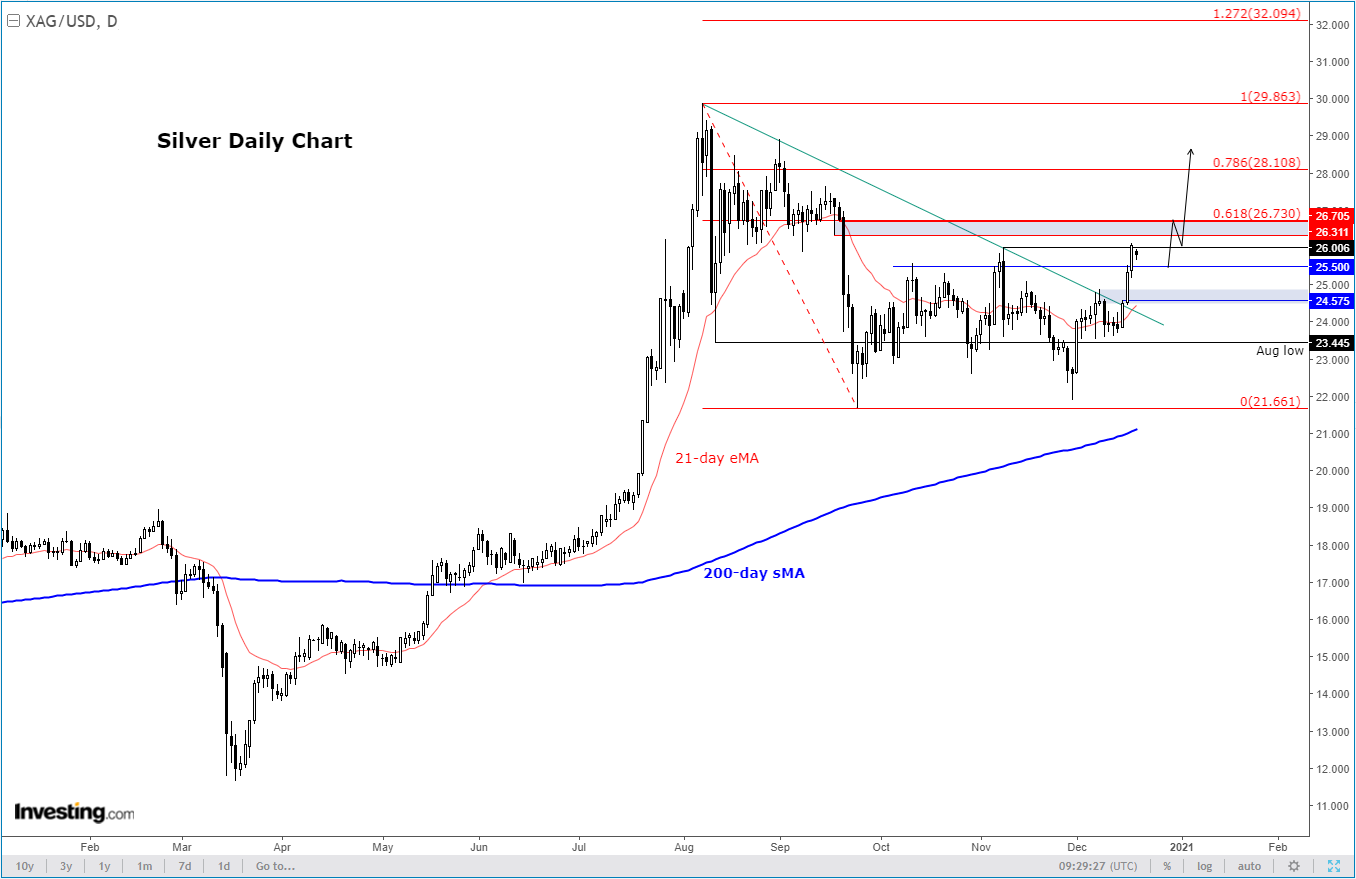
Anyway, focusing back to the charts, silver’s lengthy consolidation phase has been resolved by its price breaking higher this week:

The breakout has seen the metal take out a number of short-term resistance levels including $25, before running into a bit of resistance amid profit-taking around $26. But with the trend line broken, the path of least resistance is now to the upside. The dips back to old resistance levels should be supported in my view.
The next potential trouble area is between $26.30 to $26.70, an area which marks the point of origin of the big breakdown back in September and the 61.8% Fibonacci retracement level against the August high. If silver manages to clear this hurdle, then this could ignite a fresh rally that could see it take out this year’s high and enter the $30.00 zone.
