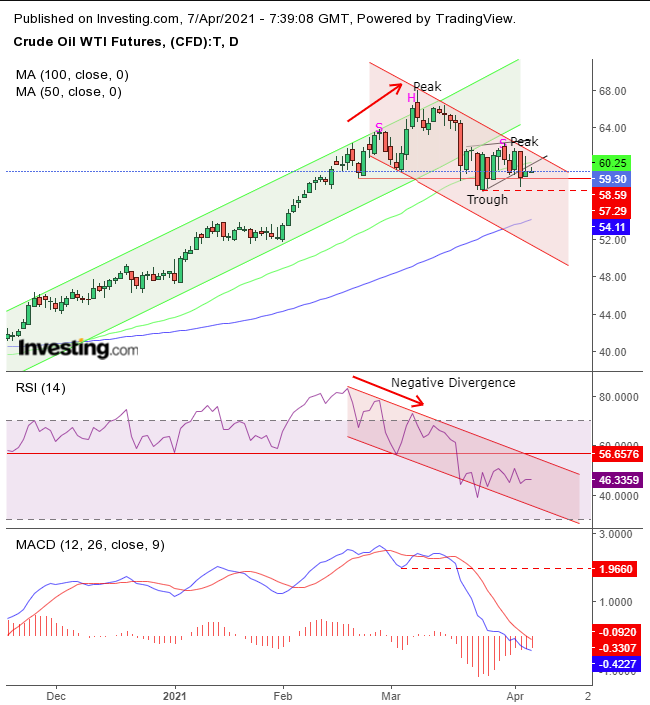
Since both the known macroeconomic and fundamental outlooks are positive for oil, wouldn't it make sense to be bullish on the energy commodity?
Increasing vaccinations in the US will allow for a quicker return to a normal economy, while the Biden Administration’s fiscal policy has boosted stocks to a series of fresh records. The logical result of, not just a restarting economy but one pushed into expansion, would be the expectation that demand for the energy commodity would increase, for both travel and industry.
Indeed, based on yesterday's API crude inventories release, in the US—the world’s biggest fuel consumer—stocks declined, which would explain today's second-day, WTI rally.
Why, then, are the technicals weak, with the price of crude sitting on the cusp of a downside reversal?

WTI has fallen out of its rising channel since the October bottom, developing a full bearish pattern beneath it, to boot. The price may have completed a rising flag, bearish after it plunged out of its bullish channel—itself a bearish indication.
For a third day, the contract is trading below the flag, as well as below the 50 DMA, for the first time since the price crossed over it in November.
Still, we’d prefer to see a long, solid red candle, clear of the flag, to reduce the chances of a bear trap. If that happens, the price will have also completed a H&S top, which would complete an official peak-and-trough downtrend.
The RSI is projecting a negative divergence between the falling momentum to the rising price between February and March, as it already established a downturn. The MACD’s short MA crossed below the long MA and topped out in mid-March.
Despite all these negative indications, it's important to note that the downside breakout of the flag is not yet decisive, the H&S has not yet completed with a downside breakout, and the peak-trough formation is not yet descending.
Trading Strategies – Short Position Setup
Conservative traders should wait on the short for the price to develop at least one, long, solid candle below the Mar. 24 trough, after which the price may find support by the 100 DMA and bounce back within a return move to retest the pattern.
Moderate traders would be content with a close below the previous low, then they might wait for a corrective rally, for a better entry, if not for confirmation of resistance.
Aggressive traders could short at will, provided they understand the added risk of a beartrap is the price for being a step ahead of the market, for the higher reward. Money management is crucial.
Here’s a basic example
Trade Sample
- Entry: $60
- Stop-Loss: $61
- Risk: $1
- Target: $55
- Reward: $5
- Risk:Reward Ratio: 1:5
Author's Note: This is just a sample, implying there are other valid ways to approach this trade, depending upon your timing, budget and temperament. Until you learn how to customize trade plans, take small risks, for educational, not profit-making purposes, or you’ll end up with neither.
