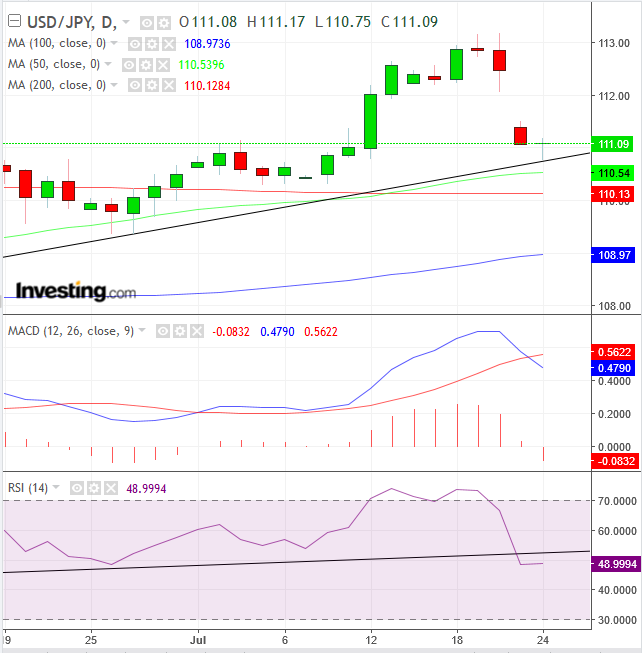
Donald Trump's dollar bashing has boosted the yen and traders today bid up the Japanese currency on speculation that the Bank of Japan might finally begin scaling back its sizeable quantitative easing program. The yen, however, gave up its three-day climb later on Monday—pressured lower by a technical driver, rather than any known fundamental reason.

When the price touched the uptrend line since late March, it drew back, revealing demand patiently waits by the technical level. Below, the 50 DMA "guards" the uptrend line, after crossing above the 200 DMA last week and triggering a golden cross, considered a very bullish indicator.
On the other hand, both the MACD and the RSI provided sell signals. The MACD’s shorter MA (blue) crossed below the longer MA (red), as current prices fall relative to older rates. The RSI tracks momentum, suggesting prices may lower, as well.
However, the rebound on top of the uptrend line confirms the trend. Should the price close at these levels, they would form a hammer, another bullish indicator. Traders say that a bottom has been “hammered out,” expecting a rally to follow. Note, the price may retest the hammer’s support before it presumably takes off.
Why would there be demand at these technical levels? Probably for a double USD dynamic: the dollar rises during both risk-off AND risk-on.
-
The greenback replaced the yen, the Swiss franc and gold, as the ultimate safe-haven asset, as it did in the 2008 financial crash.
-
The widening gap between the two countries' interest rates means traders earn a higher yield for holding the dollar against the yen.
Trading Strategies – Long Position Setup
Conservative traders would wait for a new peak to be posted, to confirm the uptrend.
Moderate traders may enter a position after a follow-up candle successfully retests its support.
Aggressive traders may risk a long entry upon a close above 111.10, providing they can afford a stop-loss below the hammers’ 110.75 low or predetermine how much they’re willing to risk on this position within the overall management of their account.
Equity Management
Trading can be called a profession when carried out based on specific rules. Taking a trading position based on impulsive decisions is gambling, and unfairly gives the business a bad name.
A professional trader sets out an equity management plan according to the three variables: his own temperament, equity and time.
Losing trades is the costs of doing business. If a trader doesn’t keep costs down, he’ll go out of business. Therefore, only “buy” bargain trades, with a minimum of 1:3 risk-reward ratio, based on the trades’ outlook. If not, wait for it. You don’t make money for entering trades, only when you profit. A favorable risk-reward ratio provides you with an overall statistical advantage.
