Braemar’s H125 results were in line with expectations, with modest revenue growth and some operational gearing evident in operating profit. The underlying activities continue to expand and diversify and Braemar remains well-positioned to drive its growth strategy. The trading outlook for FY25 is promising and we expect the company to be able to leverage its strong balance sheet in pursuit of strategic growth in a fragmented market. We maintain our underlying revenue and operating profit estimates for FY25 and FY26, as well as our 535p valuation, although EPS is affected by a reassessment of the number of shares in issue. Estimated end-FY25 net cash improves to £2.5m from a more modest net cash position.

Note: *PBT and EPS are normalised, excluding amortisation of acquired intangibles, exceptional items and share-based payments.
Benefits of diversification seen in H125 results
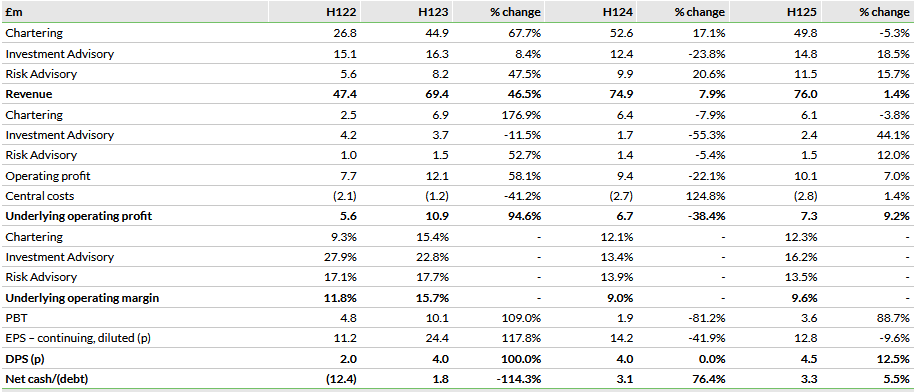
Braemar reported H125 revenue of £76.0m, up 1.4% in sterling terms and 3% in US dollar terms. The company opened a new office in South Korea and investors can expect further geographic diversification. In the period, average revenue per head remained strong at £181k (H124: £184k), which in US dollar terms was $227k, down slightly from $228k. Underlying operating profit, including acquisition-related expenditure, was up 9.2% to £7.3m (H124: £6.7m), highlighting the operational leverage within the business. As a result of the group’s trading performance and management’s increased confidence, the interim dividend was raised by 12.5% to 4.5p (H124: 4.0p). Braemar ended the period with net cash of £3.3m, up 5.5% on the previous year, highlighting the company’s cash-generative nature.
FY25 profit target expected to be achieved
In FY23 and FY24, Braemar achieved its medium-term target of achieving a sustainable doubling of FY21’s underlying operating profit of £8.9m by FY25 and it is confident that the same can be achieved this year. We remain confident that the company can grow further, given the growth strategy, ungeared balance sheet and fragmented markets. The acquisitions made over the last two years are good examples of expansion, as are the new desks opened in South Korea and Singapore, with others set to follow.
Unchanged valuation offers material upside
The outlook for the group is encouraging, underpinned by the forward order book, which stood at $80.9m at the end of August and had risen to $85.8m by 30 September 2024. Furthermore, the global fleet continues to age, implying that pent-up renewal demand will need to be addressed in the foreseeable future. Our PBT forecasts are largely unchanged, but FY25 and FY26 EPS are reduced due to changes in the forecast number of shares outstanding and we retain our 535p dividend discount model (DDM) based valuation.
Diversification delivers in tough markets
Braemar’s interim results highlight the benefit of both the increased geographic diversification of its operations and the expansion of its activities over the last few years in tough markets. H125 revenue increased by c 1% and operating profit rose by c 9%, demonstrating attractive operational gearing. The interims imply that the company is on course to deliver on its target of doubling FY21 underlying adjusted operating profit by FY25, as it did in FY23 and FY24. We believe the results confirm that Braemar’s growth strategy is working well and is likely to result in continued investment in organic growth and new desks, potential M&A in a fragmented global market and higher dividend payouts for shareholders. Braemar trades on a P/E of just 6.7x in FY25e and yields 5.3% on a well-covered dividend. Our DDM valuation is unchanged at 535p/share.
Mixed revenue performance, profits up
Braemar reported H125 revenue of £76.0m, up 1.4% in sterling terms and 3% in US dollar terms, the latter being a better measure of the group’s underlying performance, as a majority of revenue is generated in US dollars. The company opened a new office in South Korea, which, although small, highlights the ongoing geographic diversification strategy; investors can expect further diversification. In the period, average revenue per head remained strong at £181k (H124: £184k), which in US dollar terms was $227k, down slightly from $228k, and costs remained under control, rising by just 1% despite an inflationary environment.
Underlying operating profit, including acquisition-related expenditure, was up 9.2% to £7.3m (H124: £6.7m), highlighting the operational leverage within the business. Underlying operating profit excluding acquisition-related expenditure, which is a better measure of the underlying performance of the business, was £7.9m compared to £7.6m in the previous year. This implies that the business is well positioned to meet its FY25 target of doubling FY21 operating profit of £8.9m.
Exhibit 1: H122 to H125 results summary

Source: Braemar, Edison Investment Research
The diversification strategy is now well-established within the business and the benefits are evident. In Chartering (65% of group revenue), revenue declined 5.3% to £49.8m and operating profit slipped 3.8% to £6.1m. The decline was largely driven by a 10% decline in deep sea tanker revenue to £25.7m. Chartering revenue was negatively affected by a fall in project revenue and in the number of tanker fixtures, although this was offset by longer voyage times due to geopolitical events and higher commissions. The acquired tanker desks in the United States and Spain continued to perform strongly. Overall, tanker rates remained robust in the period and this is expected to continue. Chartering revenue from specialised tankers was marginally lower at £9.1m. Desk capacity was expanded and rates remained strong, generating higher average commission from a reduced number of fixtures.
In offshore energy services, revenue grew 16% to £4.4m, driven by a strong oil and gas market, as well as growth in the renewables sector and constrained vessel supply. In dry cargo, chartering revenue slipped 3% to £10.6m as better rates were offset by a reduced number of fixtures and brokers on the Handy and Panamax desks.
Q. Why was the number of brokers down?
However, despite this weakness in Chartering, Investment Advisory’s revenue (c 19% of revenue) increased by 18.5% to £14.8m and underlying operating profit by 44.1% to £2.4m. The key driver was sale and purchase, which grew revenue by 25% to £14.0m, driven by strong second-hand asset values, the availability of a wide range of vessels and high interest in newbuilds. As a result of the higher asset values, demolition activity was lower. Corporate finance revenue fell 40% to £0.7m as the size and number of mandates declined. Behind the scenes, Braemar continues to work on a number of transactions that may complete in H2, which may potentially improve performance.
In Risk Advisory (16% of revenue), revenue increased by 15.7% to £11.5m as market participants looked to hedge exposure and there was heightened interest from financial participants. Operating profit edged up to £1.5m. The Dry Forward Freight Agreements (FFAs) desk benefited from robust market conditions and increased interest from financial clients as geopolitical tensions continue to create market uncertainty and clients looked to hedge exposure. Braemar’s Tanker FFA desk grew for similar reasons and its Natural Gas desk continued to grow in its second year of existence.
As a result of the group’s trading performance and management’s increased confidence, the interim dividend was raised by 12.5% to 4.5p (H124: 4.0p). Braemar ended the period with net cash of £3.3m, up 5% on the previous year highlighting the company’s cash-generative nature. The outlook for the group is encouraging, underpinned by the forward order book, which stood at $80.9m at end August (29 February 2024: $82.6m, 31 August 2023: $67.2m) and had risen to $85.8m at end September 2024.
Key assumptions unchanged; share issuance updated
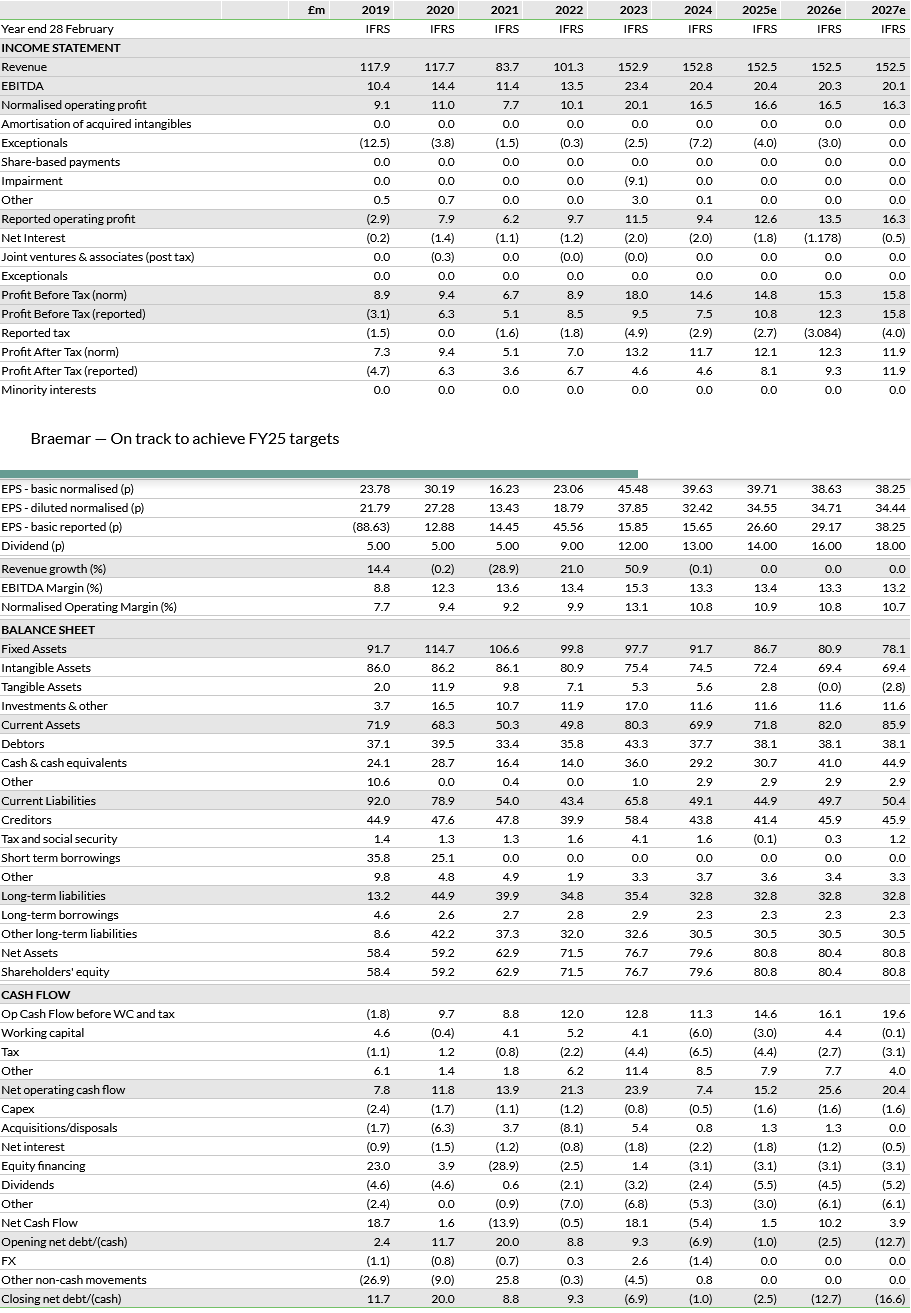
Following the interims results, we maintain our underlying assumptions for revenue and margins, implying no material change to either. However, we have updated our FY25 and FY26 estimated average number of shares in issue from 27.2m and 24.9m, to 30.5m and 31.7m, which better reflects the net effect of ESOP share purchases, deferred bonus plan share issues, share issues as consideration for M&A and underlying share issuance. Previously we had overestimated the net effect of the ESOP, which reduces the number of shares outstanding, and underestimated the share issuance from the other factors mentioned. The modest increase in PBT is more than offset by this and results in the reduction in diluted, normalised EPS, from 35.5p and 37.4p in FY25 and FY26 to 34.6p and 34.7p, respectively.
Net debt/cash also moves in a positive direction, mainly due to working capital swings, which also reduce finance charges and contribute to an improvement in PBT. Our dividend forecasts are unchanged despite the increase in the payout ratio, as is our 535p valuation. Dividend cover remains comfortably more than 2x at 2.2x in FY26e.
Exhibit 2: Revised forecast table

Source: Braemar, Edison Investment Research
Exhibit 3: Financial summary

Source: Braemar accounts, Edison Investment Research
Which stock should you buy in your very next trade?
AI computing powers are changing the stock market. Investing.com's ProPicks AI includes 6 winning stock portfolios chosen by our advanced AI. In 2024 alone, ProPicks AI identified 2 stocks that surged over 150%, 4 additional stocks that leaped over 30%, and 3 more that climbed over 25%. Which stock will be the next to soar?
Unlock ProPicks AI