This article was written exclusively for Investing.com
While the S&P 500 appears to be making new highs regularly, something is churning beneath the surface. Many stocks and sectors within the broader equity market are in a correction or a full-blown bear market. Even Amazon (NASDAQ:AMZN), which just reported a stellar first quarter, can’t seem to find a bid these days, with the shares down approximately 10% from its after-hours peak on Apr. 29.
Meanwhile, a handful of sectors have fallen by more than 20%, like the SPDR® S&P Biotech ETF (NYSE:XBI), which has fallen almost 30%. Additionally, the Invesco Solar ETF (NYSE:TAN) has dropped by roughly 40%. Even the high-flying ARK Innovation ETF (NYSE:ARKK) has fallen more than 30%.
The Carnage
The carnage has been spread across the market, with high-flying stocks, like Roku (NASDAQ:ROKU), Twilio (NYSE:TWLO), and Zoom Video (NASDAQ:ZM) plunging. Given there still elevated valuation, it doesn’t seem as if they are likely to recover anytime soon. For example, Zoom, despite falling by around 50%, still trades at 60 times 2024 earnings estimates of $4.98 per share. While Roku trades at 132 times 2023 earnings estimates of $2.58 per share.
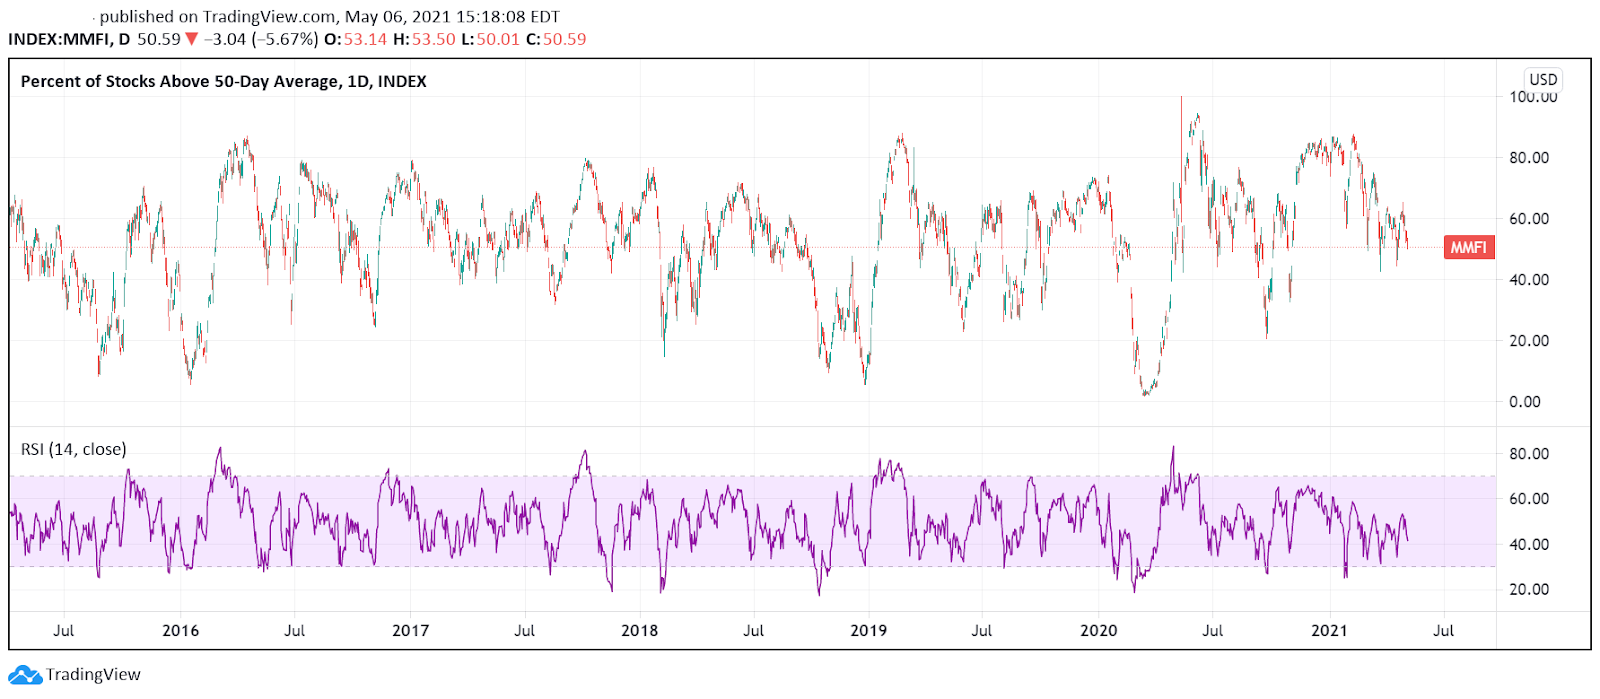
It is more than just the few names that are listed above. There is a notable breakdown that is occurring within the percentage of stocks in the equity market above their 50 day-moving average drifting lower since the middle of February. Currently, it stands at just 50%, down from around 85%.

Divergences
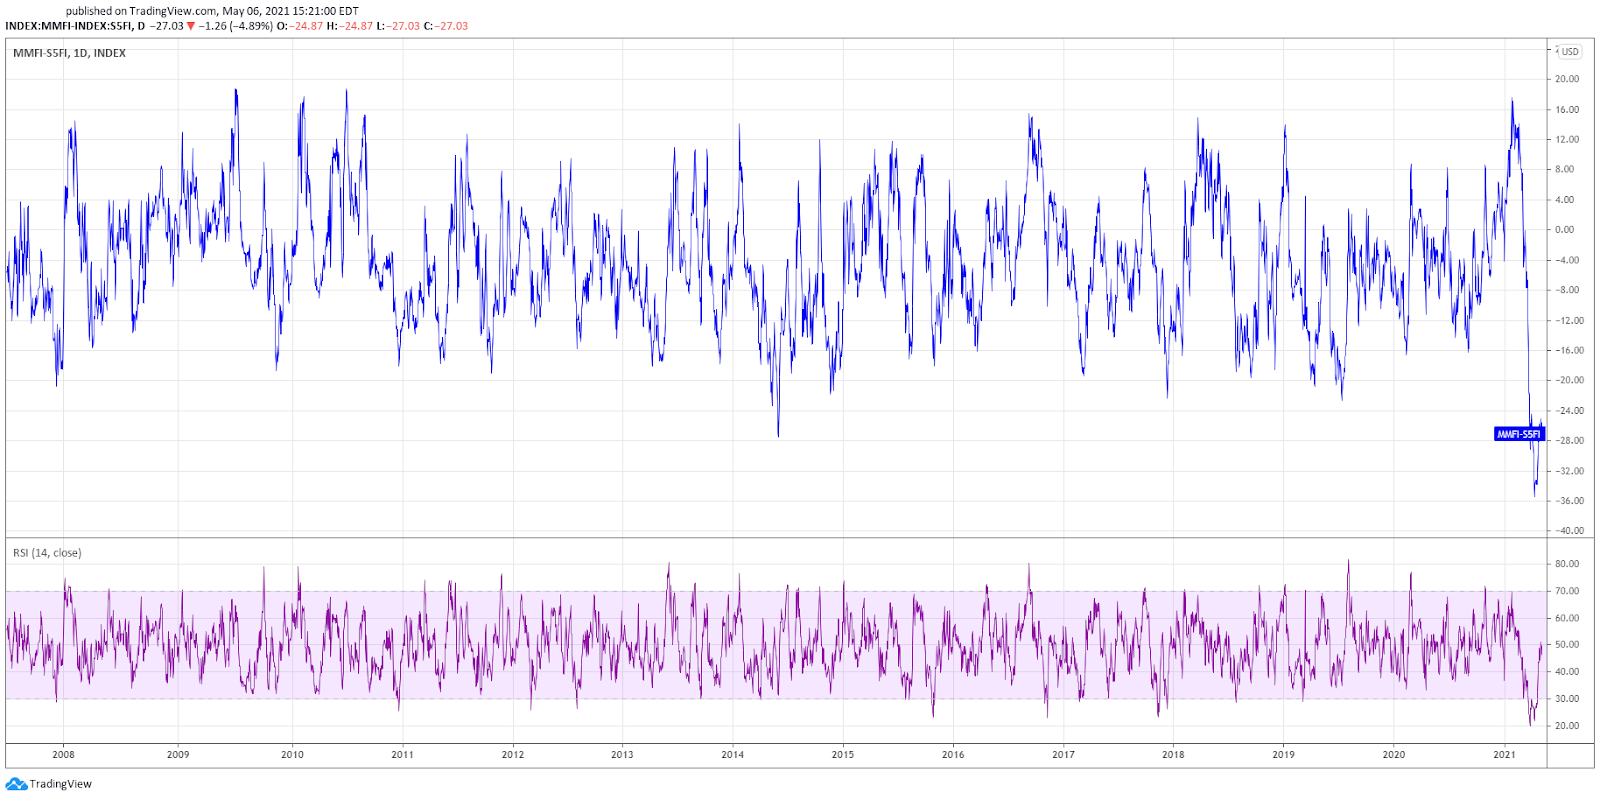
More startling is the difference between the percentage of stocks in the market above their 50-day moving average versus the same percentage in the S&P 500. Currently, the difference is around 27%, the widest that difference has been going back to 2007.

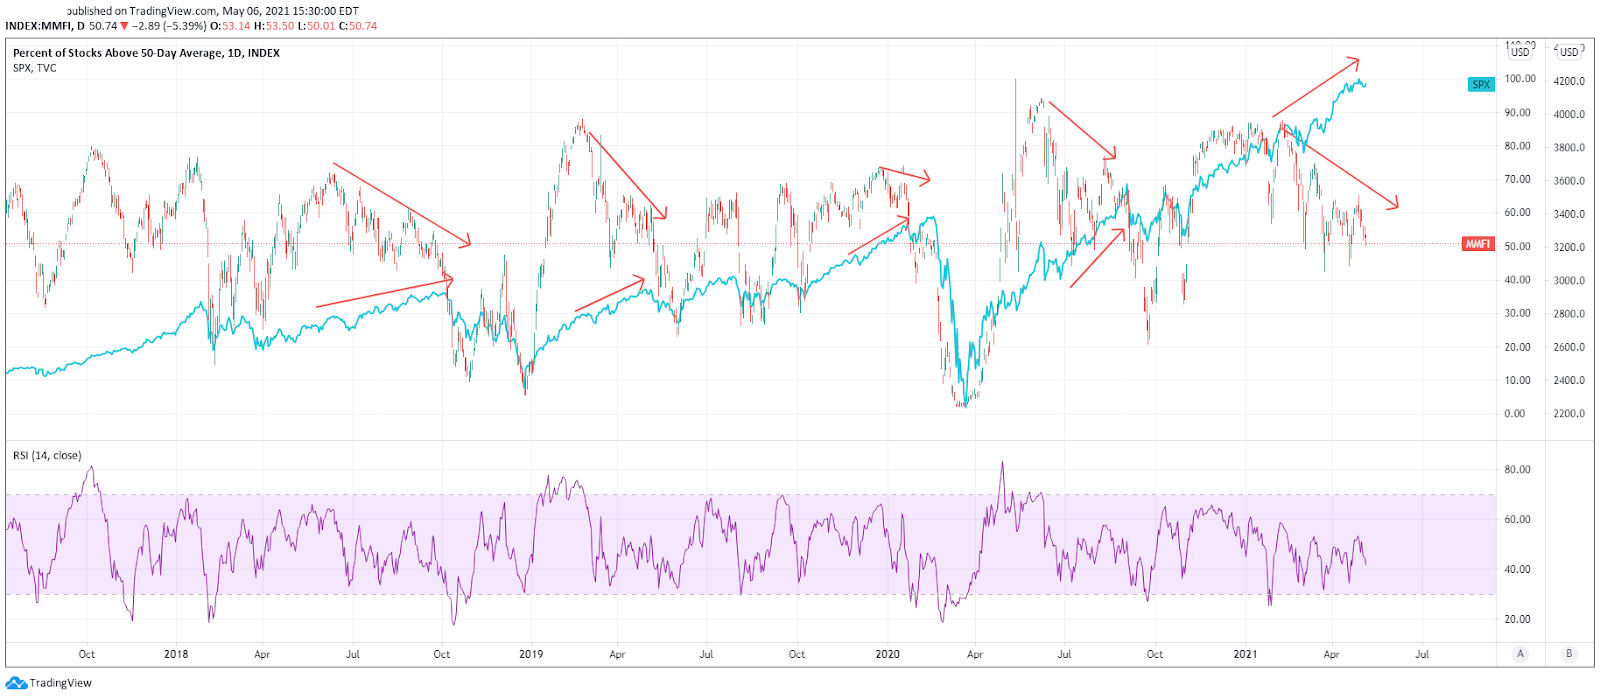
It is worth noting that this divergence doesn’t stop there. When the percentage of stocks above their 50-day moving average is trending lower as the S&P 500 rises, the market tends to eventually follow the trend of the stocks above their 50-day moving average.

It seems to suggest that while all seems fine on the surface, beneath the surface, given the size of some of the declines, something more sinister is going on. Perhaps, even a stealth bear market that has yet to reach the surface of the larger cap S&P 500 components.
Pain to Come?
Whether the larger, by market cap, S&P 500 is ready to correct is open to debate. Indeed, one could argue, something strange is going on. Even some of the biggest companies outside of Amazon have reported stellar earnings and plunged. Advanced Micro Devices (NASDAQ:AMD) and Intel (NASDAQ:INTC) are other examples of a few stock struggling to rally, despite strong results. It could be that the market is telling us that the road is getting tough for these companies going forward and that the easy gains are gone.
Whatever may be going on beneath the surface, there is a lot of carnage taking place. Many sectors and stocks have been getting hammered, while the big indices keep racing to higher and higher levels. Is it a warning sign of pain to come to the S&P 500 in the near term? Or is there just a stealth bear market taking place as sector rotations play out? Only time will tell.
Which stock should you buy in your very next trade?
AI computing powers are changing the stock market. Investing.com's ProPicks AI includes 6 winning stock portfolios chosen by our advanced AI. In 2024 alone, ProPicks AI identified 2 stocks that surged over 150%, 4 additional stocks that leaped over 30%, and 3 more that climbed over 25%. Which stock will be the next to soar?
Unlock ProPicks AI