- Alphabet is set to report its Q4 earnings after market hours today.
- While Q3 2023 saw Alphabet beating EPS and revenue estimates, a subsequent share price drop highlighted concerns about meeting cloud service revenue targets.
- In 2024, invest like the big funds from the comfort of your home with our AI-powered ProPicks stock selection tool. Learn more here>>
- Get an extra 10% off our annual and 2-year Pro+ plans with codes UKTopDiscount and UKNewYear2.
Alphabet (NASDAQ:GOOGL) (NASDAQ:GOOG), the parent company of Google, is scheduled to release its fourth-quarter earnings today.
Investors are keenly anticipating updates on Google Cloud revenue growth and insights into the company's artificial intelligence (AI) initiatives.
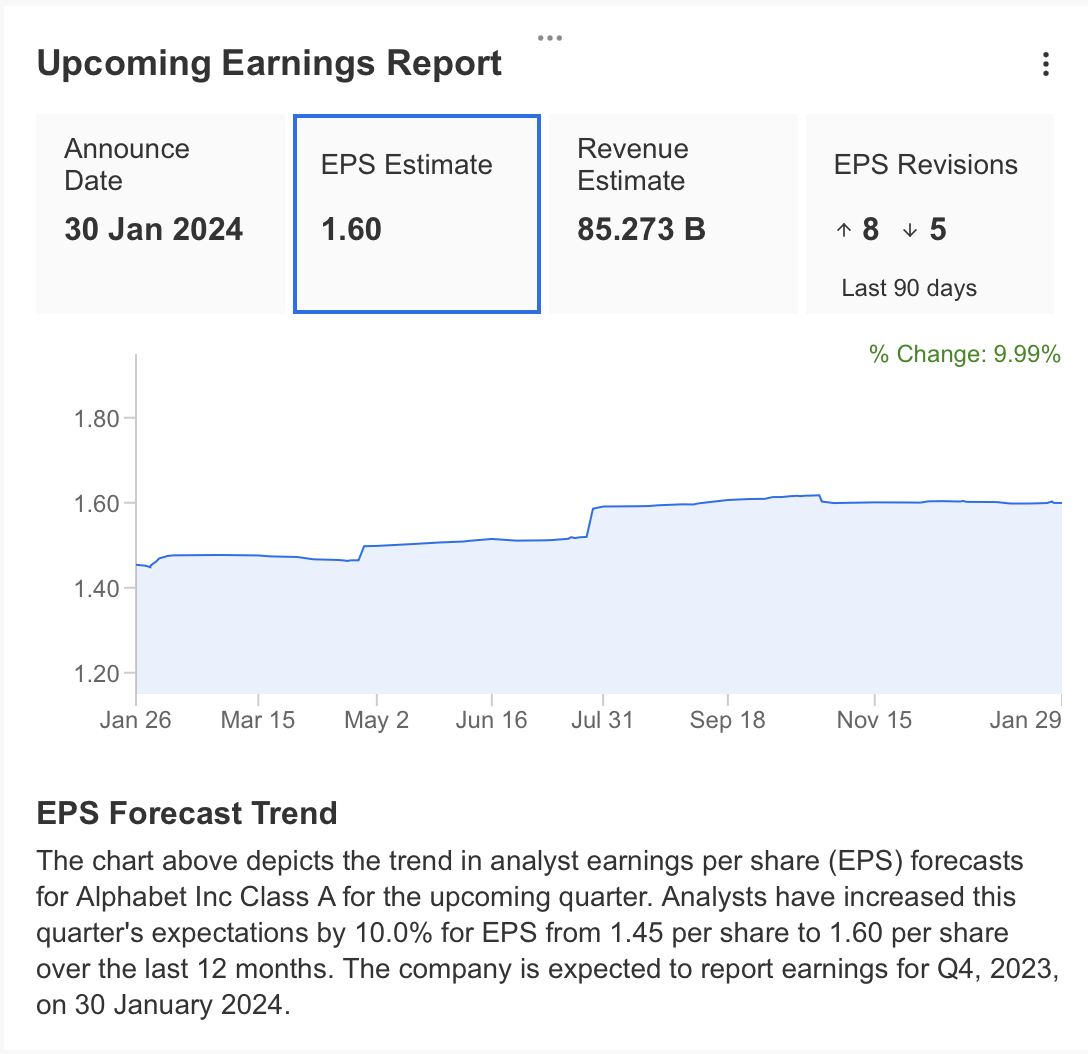
Ahead of the earnings report, InvestingPro shows that Alphabet's earnings per share and revenue expectations are high.
The company is expected to report Q4 earnings per share of $1.6, up 10%, while total revenue is expected to be $85.2 billion, up 12% year-on-year.
Source: InvestingPro
Although Alphabet announced a higher-than-expected EPS and quarterly revenue in Q3 2023, its share price fell 8% from $136.5 to $125.61 after the earnings report.
This decline was attributed to the company's failure to meet the target in cloud service revenues despite increasing its revenue.
The cloud service segment, supported by artificial intelligence, is considered by investors as one of the company's main growth items.
While it is thought that a possible market loss in this area may negatively affect the company's revenues, the income related to cloud service will be closely monitored in the 4th quarter results.
The most important part of the company's revenue is advertising revenues.
While the soft landing rhetoric continues in the US, the thought that the interest rate hike cycle has come to an end may also contribute positively to Alphabet's advertising revenues throughout 2024.
If companies, which will have the potential to act more financially comfortable with the start of interest rate cuts, tend to increase their advertising spending, Alphabet will get a significant share of this trend.
Thus, the company is entering an important period to reap the rewards of its significant AI investments in cloud services and advertising.
Alphabet's Strengths and Weaknesses Ahead of Earnings, According to ProTips
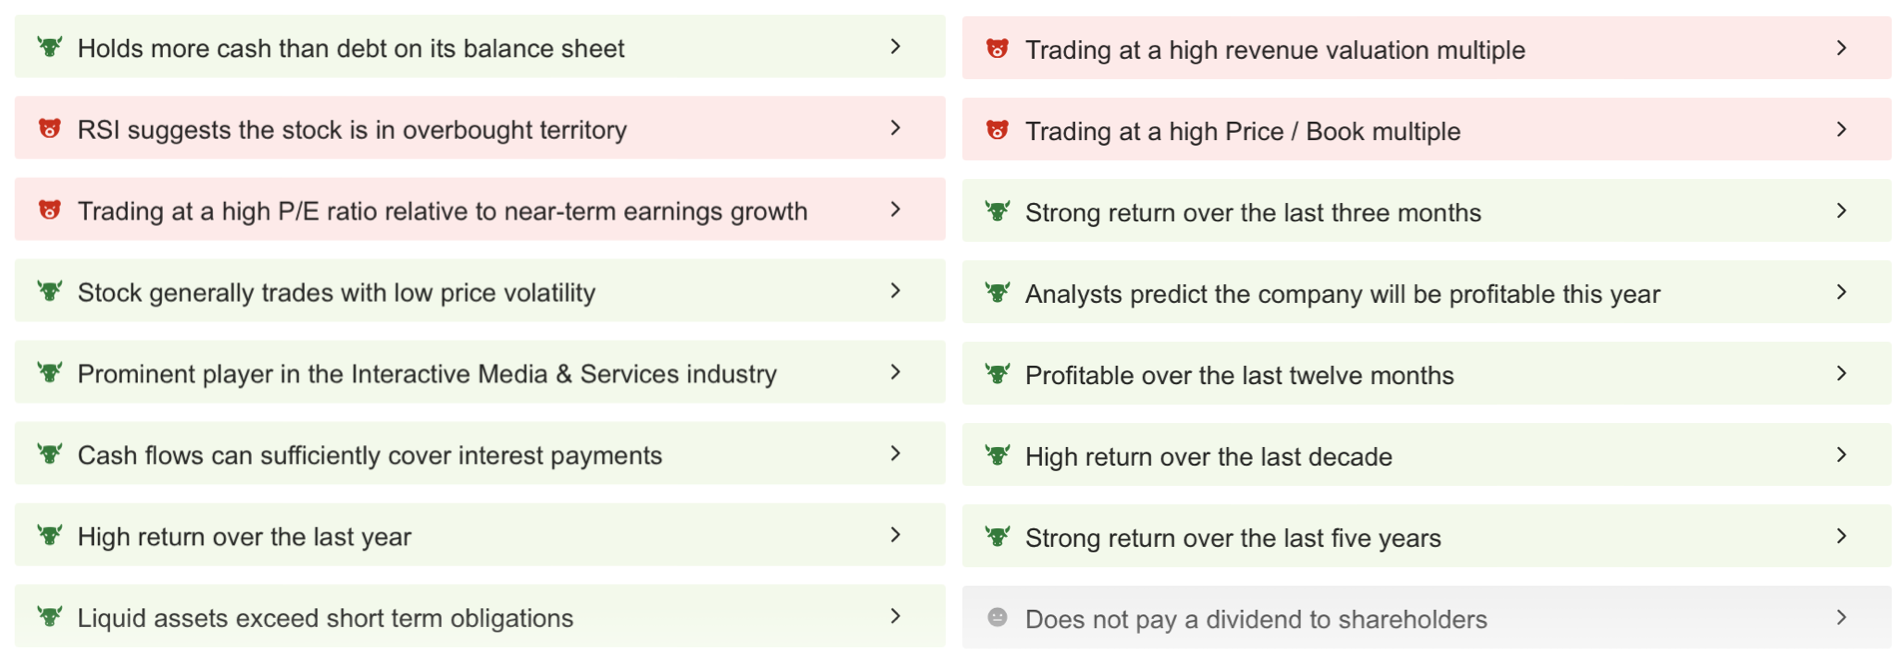
With ProTips, an important service offered by InvestingPro, we can quickly see Alphabet's strengths and weaknesses before the earnings report.
Thus, after the earnings report, we can more clearly address the items where the company has improved or regressed financially.
In this way, ProTips provides us with important data for making an investment decision in Alphabet.
ProTips analyzes hundreds of complex financial data and models of a company and provides a simple yet effective report to its users.
Source: InvestingPro
In the case of Alphabet, the ProTips report shows that the company's strengths outweigh its weaknesses.
Accordingly, Alphabet's main strength is that the amount of cash on its balance sheet is higher than its debt.
This outlook is very positive in terms of providing the company with the flexibility to overcome possible crisis periods more easily or to continue its investments.
How Does Alphabet Fare in Comparison to Peers?
However, when we take a look at the peer comparison; it can be seen that competitors are in a better position in the Net Debt / Total Capital ratio. 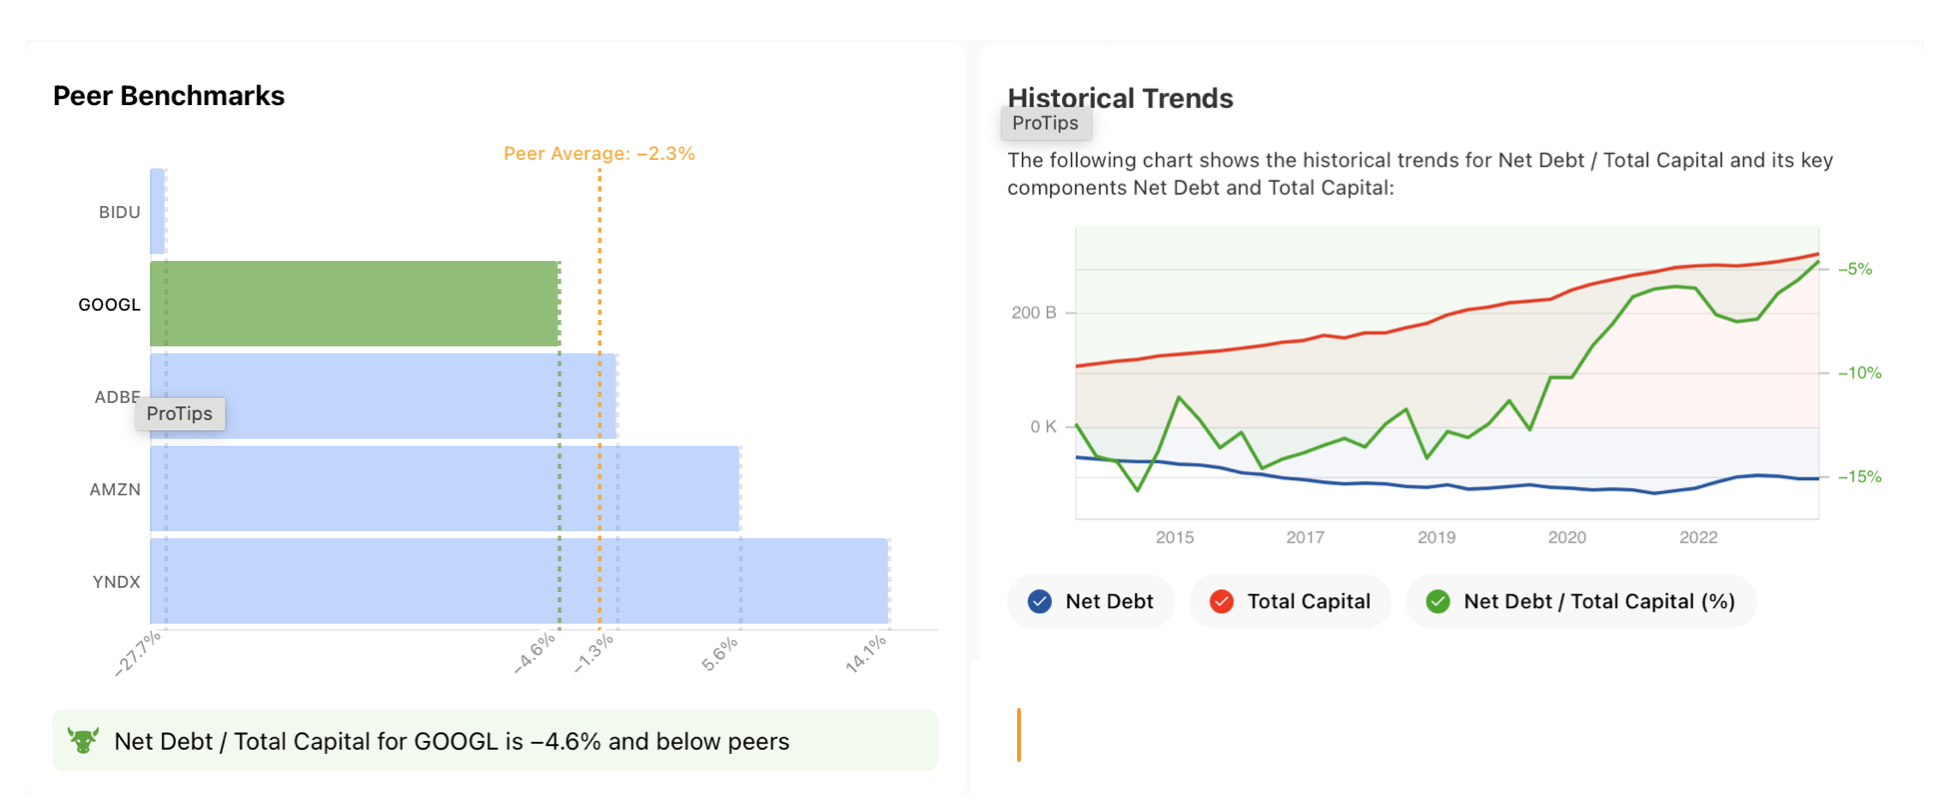
Source: InvestingPro
Nevertheless, it is seen that Alphabet has increased its total capital faster in the last 10 years, while its net debt momentum has remained lower.
The fact that the Net Debt / Total Capital ratio has regained momentum, especially according to last year's activities, can be considered quite positive in terms of financial stability.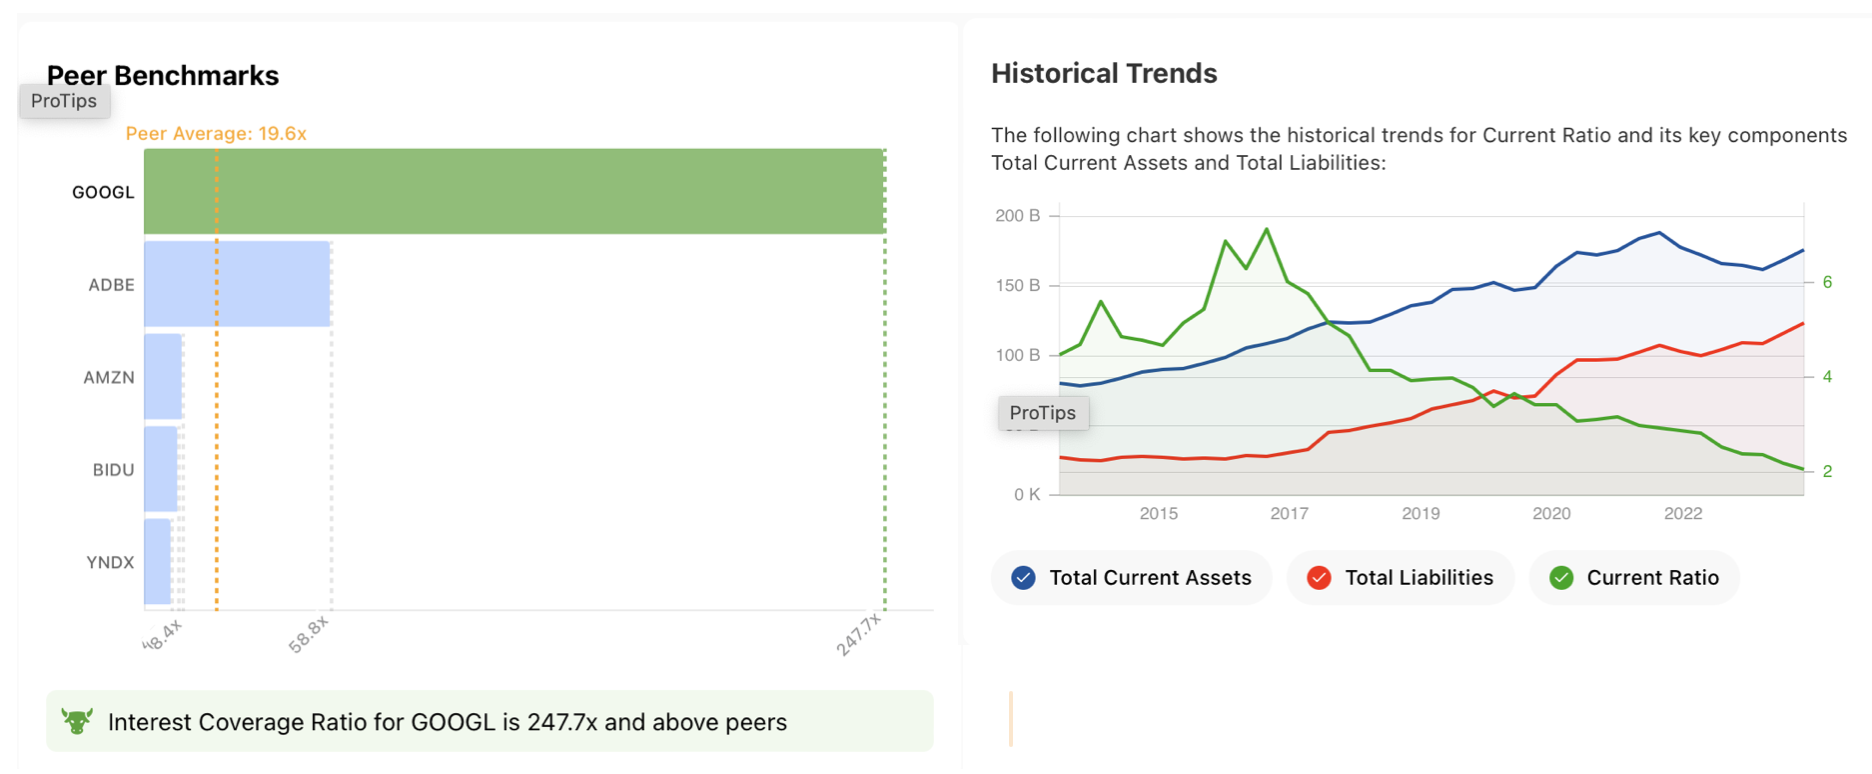
Source: InvestingPro
On the other hand, the company's cash flow to interest expense coverage ratio is very high at 247.7X, which is a very positive differentiation from peer companies in this respect.
Alphabet also shows that it has strong liquidity in the short term with a current ratio of 2X and that it uses its assets efficiently in the short term.
Other positives for Alphabet highlighted in theProTips report are that GOOGL's share generally moves at low volatility and maintains strong performance in the short and long term.
If we consider Alphabet's weaknesses; the fact that the company does not pay dividends can be seen as a handicap for investors.
However, technically, in the long-term uptrend, the RSI indicates that it is in the overbought zone, indicating that the possibility of a correction in the stock is preserved. 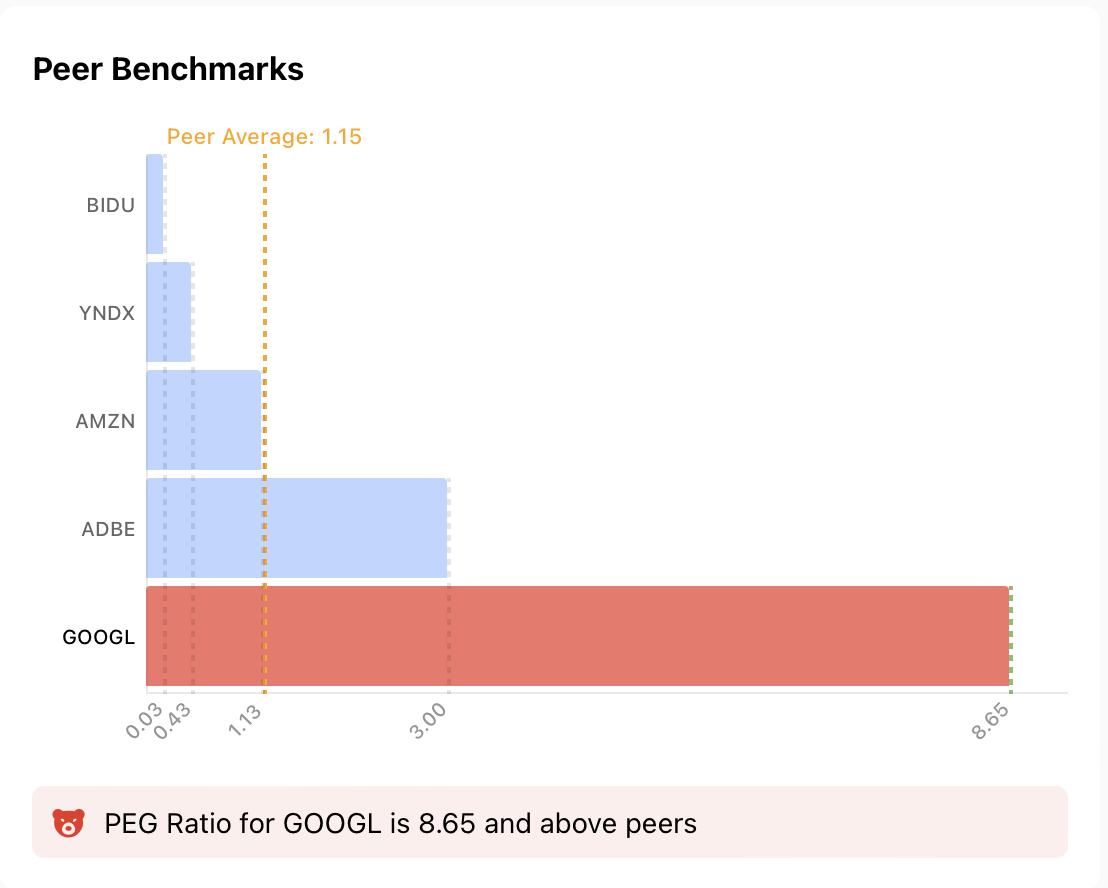
Source: InvestingPro
Other weaknesses include the company's high P/E ratio relative to short-term profit growth. Alphabet currently has a P/E of 8.65X, well above its peers.
While this shows that the share price remains high compared to the company's earnings, it once again increases the importance of the last quarter's earnings to be announced today.
Accordingly, a higher-than-expected revenue can be considered as data that will support a high P/E.
Otherwise, while it is thought that the P/E will rise further, the overvalued status of the share price may continue and increase the possibility of a possible correction.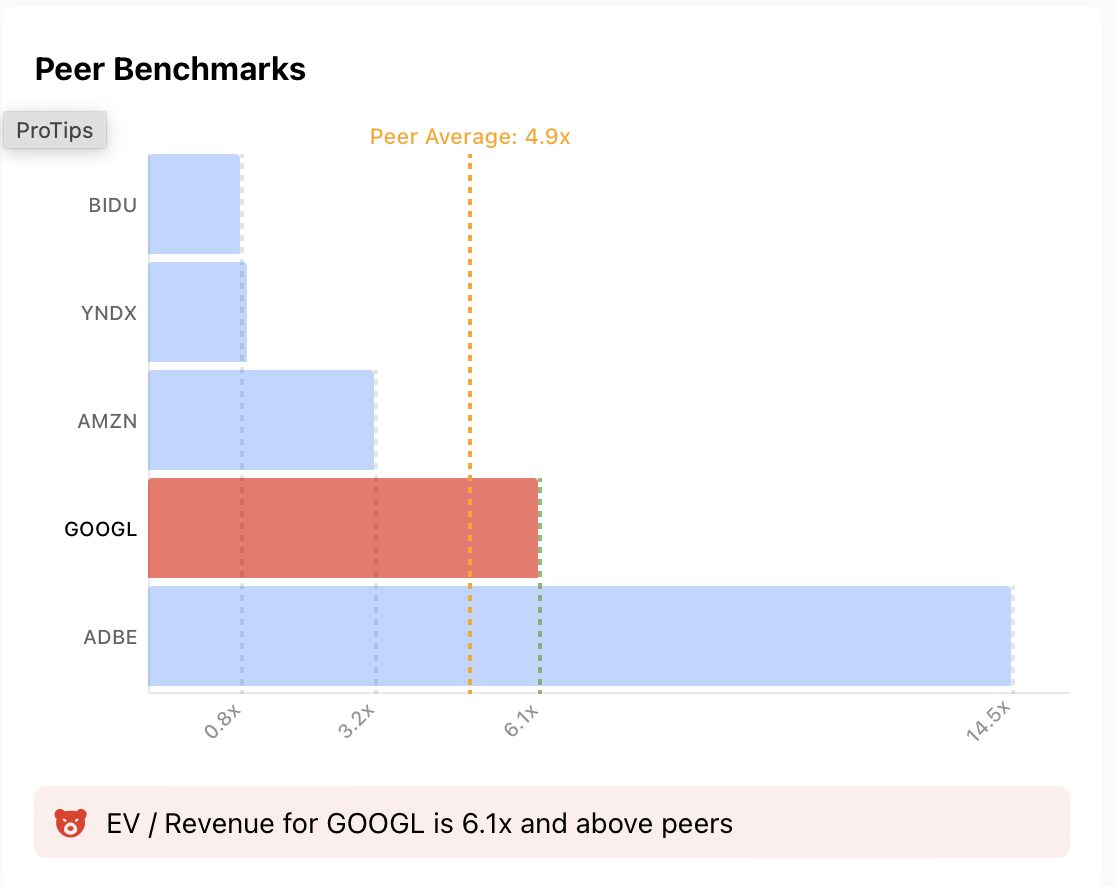
Source: InvestingPro
Another ratio that raises the risk profile in Alphabet investment is that the company is traded at a high valuation relative to its revenue.
The Enterprise Value to Revenue ratio currently stands at 6.1X for Alphabet, above the peer average.
This will strengthen the possibility that GOOGL's price will enter a correction trend in the coming periods to reflect the company's revenue in the absence of an acceleration in revenue growth.
In addition, the high ratio of the share price to the book value of the company also supports the risk of a correction.
In conclusion, according to the inferences drawn from Alphabet's financial results, it can be said that its financial health is performing quite well.
The fact that GOOGL is priced above its value with its long-term uptrend and strong financials can also be interpreted as investors maintaining their confidence in the company.
Technical View: Alphabet Stock Up Against Resistance
Technically, GOOGL stock has rallied toward the $ 153 level while maintaining its positive outlook before the earnings report.
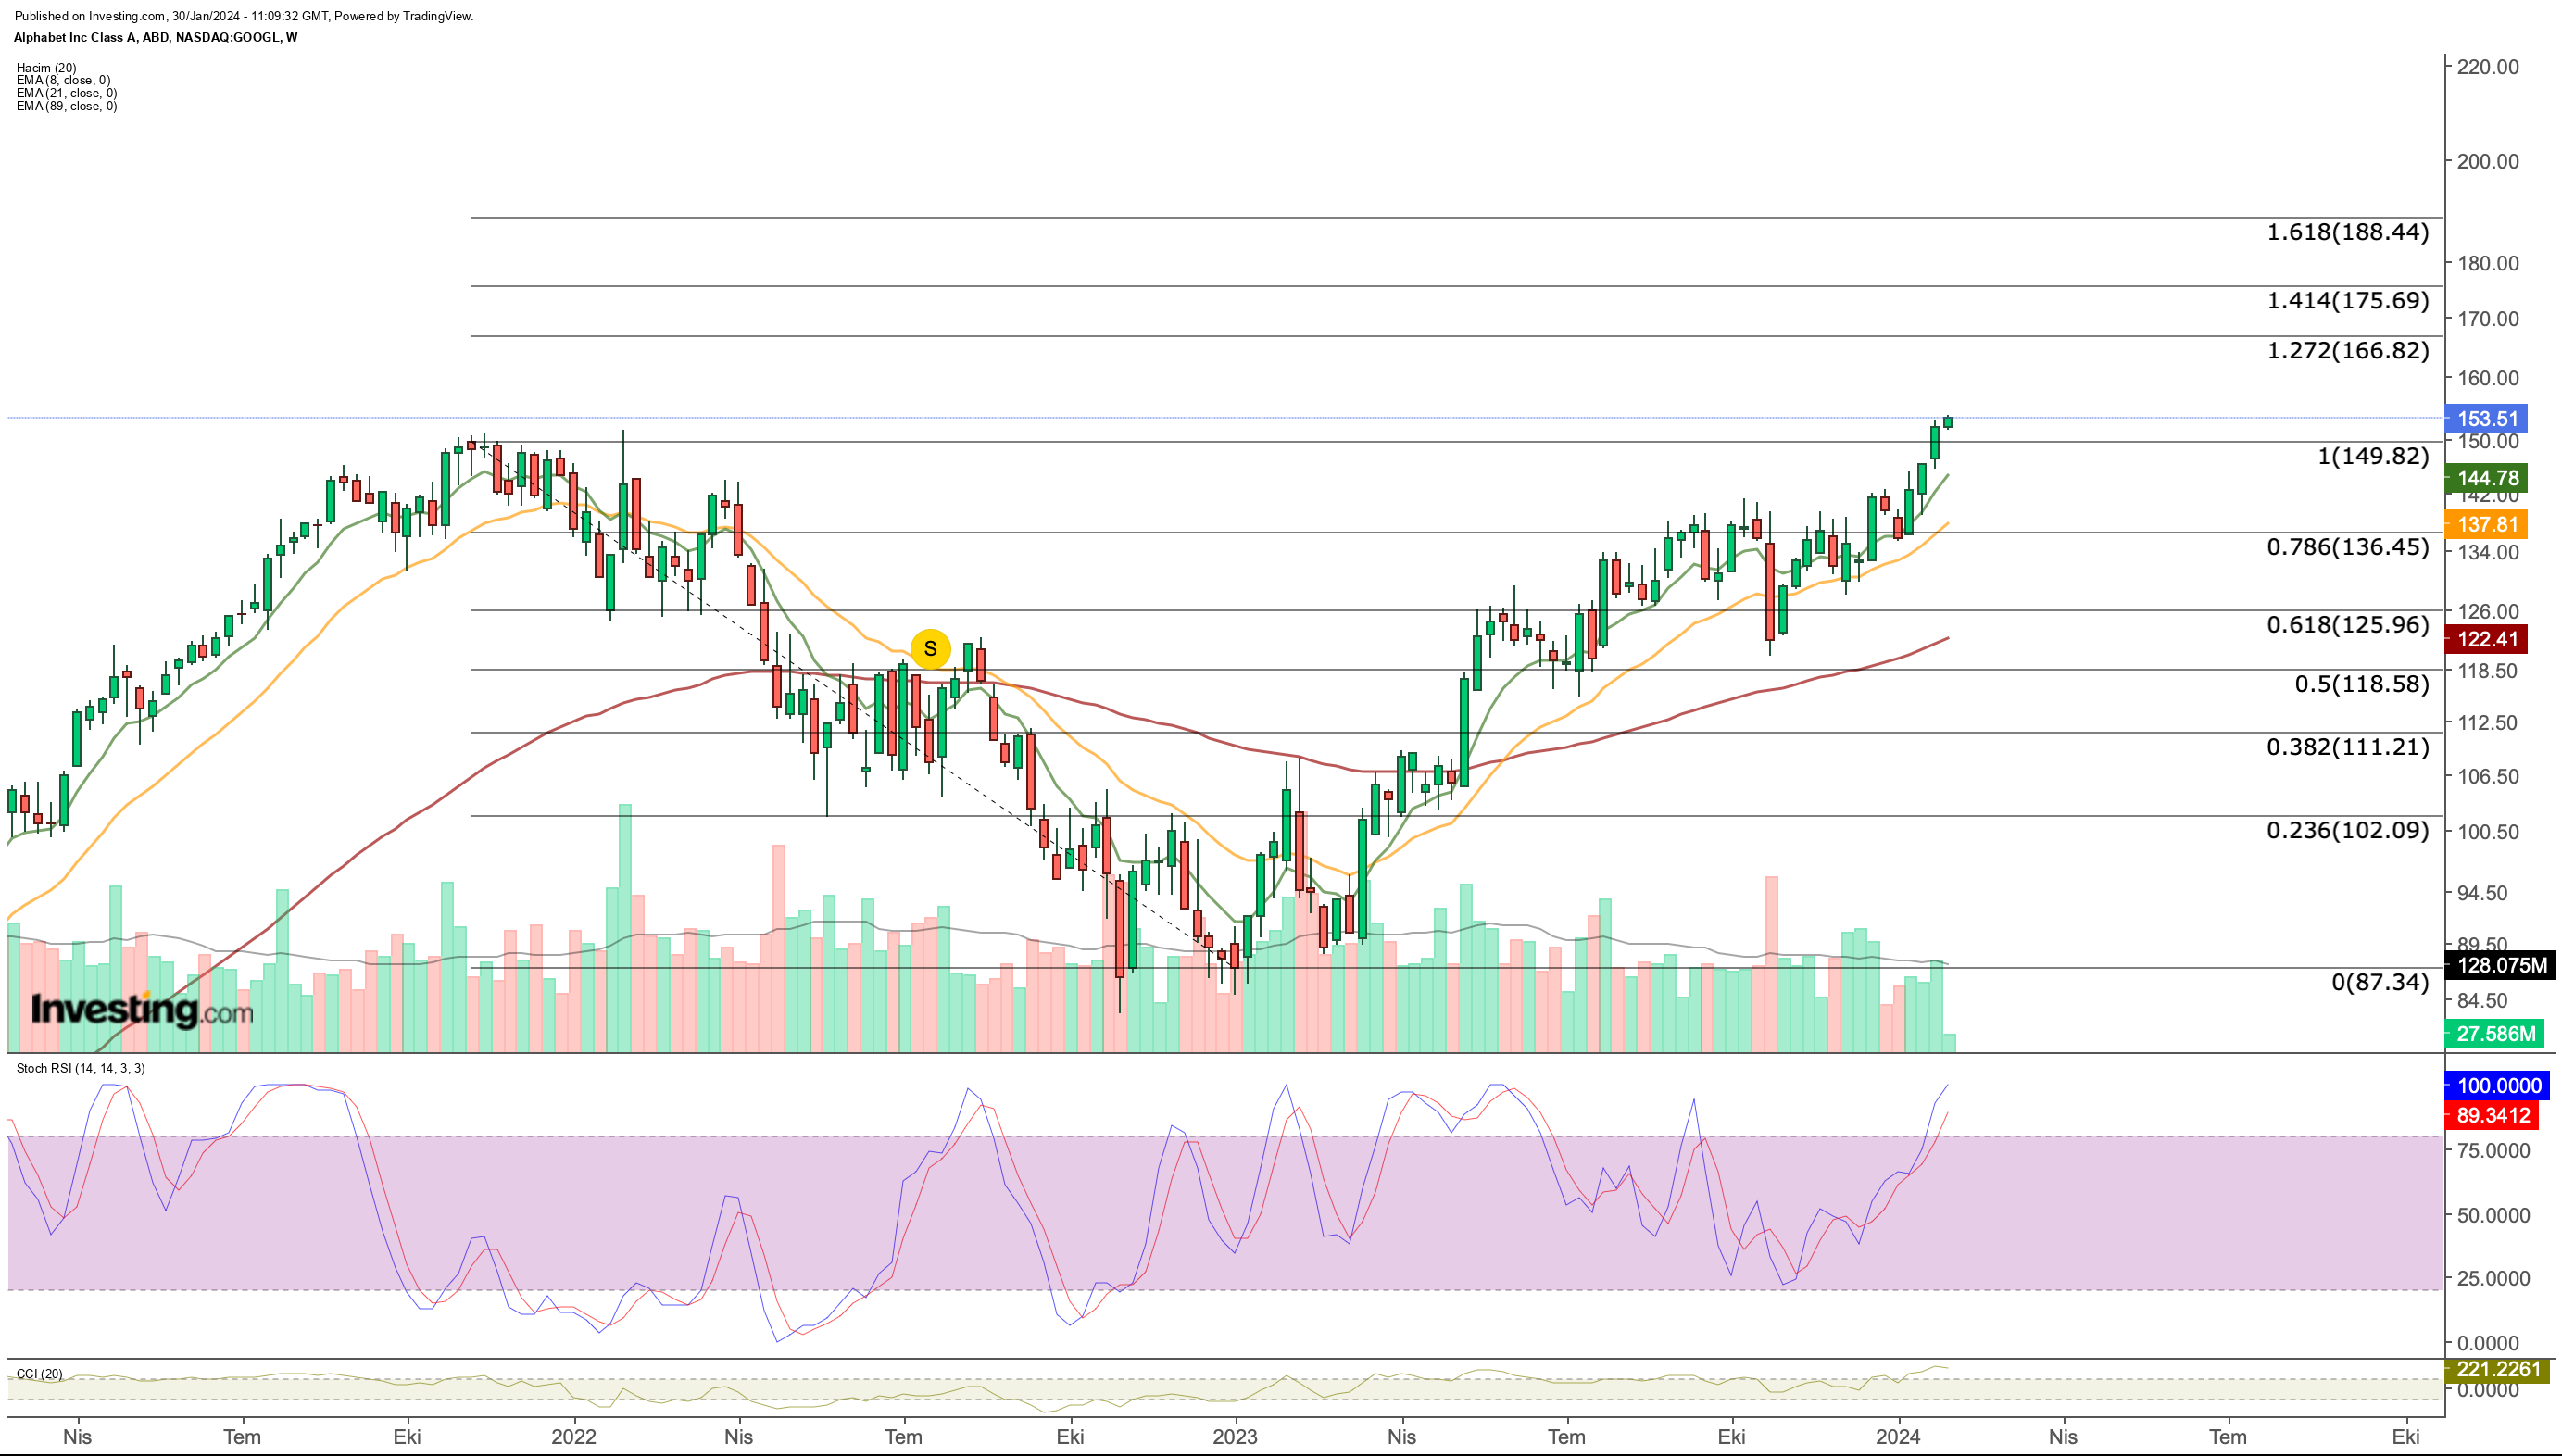
According to the latest outlook, as long as the stock stays above its last peak at $150, it can move towards the Fibonacci expansion level zone of $166 - $188.
On the other hand, in case of a weekly close below $150, the risk of correction will increase and this time a downward momentum may occur up to an average of $125.
***
Take your investing game to the next level in 2024 with ProPicks
Institutions and billionaire investors worldwide are already well ahead of the game when it comes to AI-powered investing, extensively using, customizing, and developing it to bulk up their returns and minimize losses.
Now, InvestingPro users can do just the same from the comfort of their own homes with our new flagship AI-powered stock-picking tool: ProPicks.
With our six strategies, including the flagship "Tech Titans," which outperformed the market by a lofty 952% over the last decade, investors have the best selection of stocks in the market at the tip of their fingers every month.
Subscribe here for up to 50% off as part of our year-end sale and never miss a bull market again!
Get an extra 10% off our annual and 2-year Pro+ plans with codes UKTopDiscount and UKNewYear2. Limited time offer - act now!
Disclaimer: This article is written for informational purposes only; it does not constitute a solicitation, offer, advice, or recommendation to invest as such it is not intended to incentivize the purchase of assets in any way. I would like to remind you that any type of asset, is evaluated from multiple points of view and is highly risky and therefore, any investment decision and the associated risk remains with the investor.

