Benzinga - by Melanie Schaffer, Benzinga Editor.
Spear Alpha ETF (NASDAQ: SPRX) was trading flat on Wednesday, continuing to trade sideways within a tight range between about $22.60 and $24.50 on decreasing volume.
The actively managed fund provides exposure to various stocks falling under the themes of enterprise digitalization, automation and robotics, artificial intelligence (AI), environmental focus and decarbonization, photonics and additive manufacturing and space exploration. The fund has outpaced Cathie-Wood's flagship Ark Innovation ETF (ARCA: ARKK), with the former rising about 3.6% year-to-day, while ARKK has dropped 4.24% over the same time period.
Read Next: As AI Continues To Dominate Headlines, Copper's Critical Role Comes Into Focus
Trending: Crypto Trader Used This Strategy To Avoid 2021 Bitcoin Crash 'From $58K To $28K In A Matter Of Weeks'
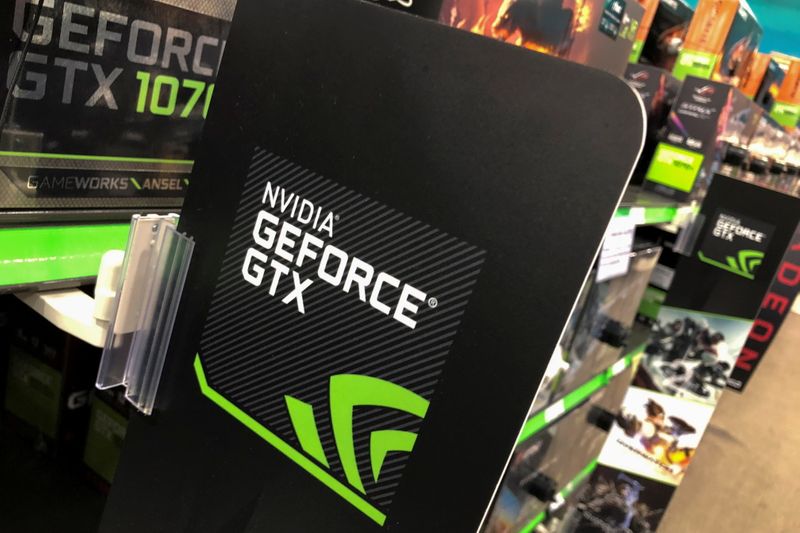
Recently, some of the stocks within the fund have been trading within reach of their all-time highs, indicating investors remain increasingly bullish on the companies the fund holds. NVIDIA Corporation (Nasdaq: NVDA) surged 85% this year and is the largest holding within the fund, weighted at 10.88%.
Similarly, Zscsaler, Inc (NASDAQ: ZS), the second largest holding within SPRX, weighted at 10.2% skyrocketed 193% between May 3, 2023, and Feb. 8, 2024, before beginning to retrace.
For investors, particularly those who believe in the power of diversification, SPRX holds many other popular stocks, including Advanced Micro Devices, Inc (NASDAQ: AMD), weighted at 7.84%, Snowflake, Inc (NYSE: SNOW), weighted at 7.01% and Shopify, Inc (NYSE: SHOP), weighted at 4.39%.
Want direct analysis? Find me in the BZ Pro lounge! Click here for a free trial.
The SPRX Chart: After reaching a new all-time high of $25.66 on Feb.12, SPRX entered into a downtrend, retracing about 11.96% between that date and March 19. On Monday, SPRX negated the downtrend by forming a higher low above the most recent low of $22.59 and on Wednesday, the fund retested that level and support and bounced upward.
- The back test of the support area has caused SPRX to print a possible double-bottom pattern at that level. If the formation is recognized, SPRX is likely to bounce up higher over the coming trading days. For a new uptrend to confirm, the fund will eventually need to print a higher high above the March 21 high of $24.02.
- During SPRX’s retracement, volume within the fund has been decreasing, which indicates healthy consolidation is taking place rather than that the bears have gained control. If the ETF breaks to a higher high, big bullish volume may begin to increase.
- Bearish traders want to see SPRX drop to a new low on increasing bearish volume. If that happens, the higher low and the double bottom pattern will be negated and selling pressure could accelerate.
- SPRX has resistance above at $23.50 and at $24.47 and support below at $23.06 and at $22.78.
© 2024 Benzinga.com. Benzinga does not provide investment advice. All rights reserved.
