Benzinga - by The Arora Report, Benzinga Contributor.
To gain an edge, this is what you need to know today.
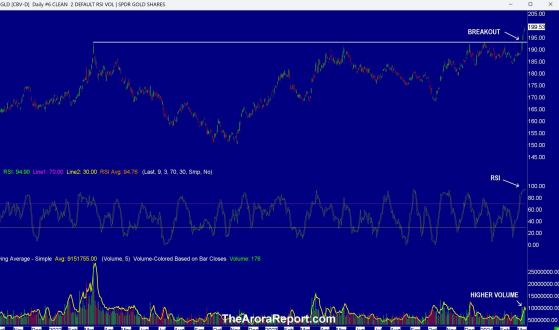
The Message For Prudent Investors Please click here for an enlarged version of the chart of SPDR Gold Trust (ARCA:GLD).
Note the following:
- The chart shows that gold has broken out to an all time high.
- The chart shows higher volume. This indicates conviction in the breakout.
- RSI shown on the chart is at an all time high. This indicates there is high momentum behind the breakout. Breakouts that happen with RSI at all time high tend to lead to big moves in the longer term. However, when RSI is this overbought, it often leads to a short term pullback.
- In The Arora Report analysis, there is an important message here for prudent investors:
- Stock market sees clear skies as far as the eye can see.
- Bitcoin (CRYPTO: BTC) is near all time high indicating that the speculative juices are running at all time high.
- NVIDIA Corp (NASDAQ: NVDA) is at an all time high and goes up every day indicating that many investors believe artificial intelligence is going to trump everything else.
- YOLO (you only live once) is taking over in penny stocks, junk stocks, highly speculative tech stocks, as well as highly speculative biotech stocks indicating the breath of extremely positive sentiment.
- Gold is bought when investors want to hedge their portfolios, when investors see trouble ahead, and when investors want to be defensive.
- Who is buying gold at a time when the sentiment is at extreme high? The answer is prudent investors who have studied the history of the markets and know that when sentiment gets this high, it is time to buy protection.
- Historically when sentiment gets this high, something comes out of the blue that nobody has foreseen to drive the stock market lower.
- Initial jobless claims came at 217K vs 217K consensus. This indicates that the jobs picture is very strong, especially at the low end. Jobs picture is weak in IT and is likely to get weaker in areas that are being impacted by AI.
- Unit Labor Costs - Rev. came at 0.4% vs 0.6% consensus. This indicates that costs are not rising as fast in manufacturing.
- Productivity - Rev. came at 3.2% vs 3.1% consensus. Higher productivity drives the stock market higher.
- Powell will be repeating his testimony in front of the Congress. Expect momo gurus to twist his testimony to run the stock market higher.
- Jobs Report, mother of all reports, will be released at 8:30am ET tomorrow. As is their pattern, momo crowd is buying ahead of the Jobs Report on hopium.
- As an actionable item, the sum total of the foregoing is in the protection band, which strikes the optimum balance between various crosscurrents. Please scroll down to see the protection band.
Japan Speculation is building that Japan will raise interest rates in March. If this occurs, this will be the first interest rate hike since 2007.
As we have written before in detail, Bank of Japan (BOJ) policies will have a major impact on the stock market in the US.
As full disclosure, two Japan related ETFs are in ZYX Allocation Core Model Portfolio.
Magnificent Seven Money Flows In the early trade, money flows are positive in Apple Inc (NASDAQ: AAPL), Amazon.com, Inc. (NASDAQ: AMZN), Alphabet Inc Class C (NASDAQ: GOOG), Meta Platforms Inc (NASDAQ: META), Microsoft Corp (NASDAQ: MSFT) and NVDA.
In the early trade, money flows are negative in Tesla Inc (NASDAQ: TSLA).
In the early trade, money flows are positive in SPDR S&P 500 ETF Trust (ARCA:SPY) and Invesco QQQ Trust Series 1 (NASDAQ: QQQ).
Momo Crowd And Smart Money In Stocks The momo crowd is buying in the early trade. Smart money is inactive in the early trade.
Gold The momo crowd is buying in the early trade. Smart money is inactive in the early trade.
For longer-term, please see gold and silver ratings.
The most popular ETF for gold is GLD. The most popular ETF for silver is iShares Silver Trust (ARCA:SLV).
Oil The momo crowd is buying oil in the early trade. Smart money is inactive in the early trade.
For longer-term, please see oil ratings.
The most popular ETF for oil is United States Oil ETF (ARCA:USO).
Bitcoin Bitcoin is range bound. Bitcoin whales are pushing the narrative of bitcoin going to $80K over the weekend. Bitcoin is trading at $67,027 as of this writing.
Protection Band And What To Do Now It is important for investors to look ahead and not in the rearview mirror.
Consider continuing to hold good, very long term, existing positions. Based on individual risk preference, consider a protection band consisting of cash or Treasury bills or short-term tactical trades as well as short to medium term hedges and short term hedges. This is a good way to protect yourself and participate in the upside at the same time.
You can determine your protection bands by adding cash to hedges. The high band of the protection is appropriate for those who are older or conservative. The low band of the protection is appropriate for those who are younger or aggressive. If you do not hedge, the total cash level should be more than stated above but significantly less than cash plus hedges.
It is worth reminding that you cannot take advantage of new upcoming opportunities if you are not holding enough cash. When adjusting hedge levels, consider adjusting partial stop quantities for stock positions (non ETF); consider using wider stops on remaining quantities and also allowing more room for high beta stocks. High beta stocks are the ones that move more than the market.
Traditional 60/40 Portfolio Probability based risk reward adjusted for inflation does not favor long duration strategic bond allocation at this time.
Those who want to stick to traditional 60% allocation to stocks and 40% to bonds may consider focusing on only high quality bonds and bonds of seven year duration or less. Those willing to bring sophistication to their investing may consider using bond ETFs as tactical positions and not strategic positions at this time.
The Arora Report is known for its accurate calls. The Arora Report correctly called the big artificial intelligence rally before anyone else, the new bull market of 2023, the bear market of 2022, new stock market highs right after the virus low in 2020, the virus drop in 2020, the DJIA rally to 30,000 when it was trading at 16,000, the start of a mega bull market in 2009, and the financial crash of 2008. Please click here to sign up for a free forever Generate Wealth Newsletter.
This article is from an unpaid external contributor. It does not represent Benzinga's reporting and has not been edited for content or accuracy.
© 2024 Benzinga.com. Benzinga does not provide investment advice. All rights reserved.