Benzinga - by Benzinga Insights, Benzinga Staff Writer.
In the ever-changing and fiercely competitive business landscape, conducting thorough company analysis is crucial for investors and industry experts. In this article, we will undertake a comprehensive industry comparison, evaluating Costco Wholesale (NASDAQ:COST) and its primary competitors in the Consumer Staples Distribution & Retail industry. By closely examining key financial metrics, market position, and growth prospects, our aim is to provide valuable insights for investors and shed light on company's performance within the industry.
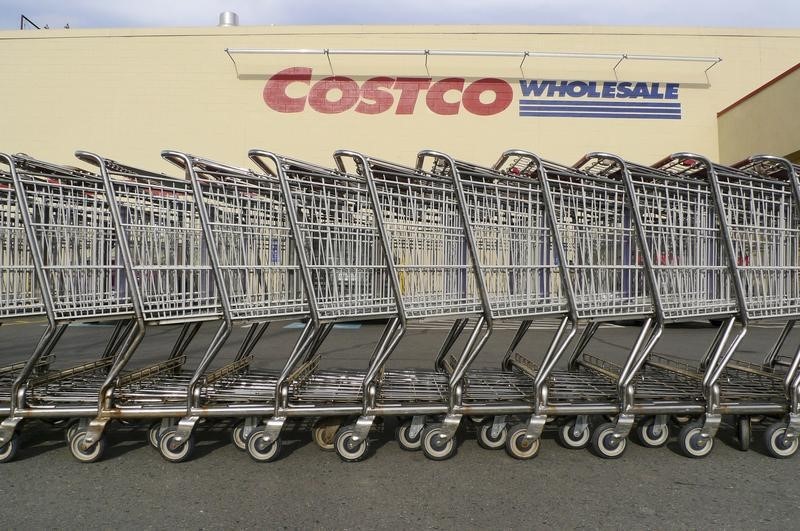
Costco Wholesale Background Costco operates a membership-based, no-frills retail model, predicated on offering a select product assortment in bulk quantities at bargain prices. The firm avoids maintaining costly product displays by keeping inventory on pallets and limits distribution expenses by storing its inventory at point of sale in the warehouse. Given Costco's frugal cost structure, the firm is able to price its merchandise below competing retailers, driving high sales volume per warehouse and allowing the retailer to generate strong profits on thin margins. Costco operates nearly 600 warehouses in the United States and boasts over 60% market share in the domestic warehouse club industry. Internationally, Costco operates another 270 warehouses, primarily in markets such as Canada, Mexico, Japan, and the U.K.
CompanyP/EP/BP/SROEEBITDA (in billions)Gross Profit (in billions)Revenue Growth| Costco Wholesale Corp | 50.77 | 12.64 | 1.35 | 6.21% | $2.65 | $7.34 | 6.18% |
| Walmart Inc | 31.14 | 5.72 | 0.75 | 6.73% | $11.33 | $41.56 | 7.83% |
| Target Corp | 19.36 | 5.61 | 0.66 | 7.93% | $2.06 | $7.25 | -4.22% |
| Dollar Tree Inc | 28.25 | 3.61 | 1.11 | 2.35% | $0.52 | $2.18 | 5.4% |
| Dollar General Corp | 16.61 | 4.91 | 0.82 | 4.33% | $0.65 | $2.81 | 2.42% |
| BJ's Wholesale Club Holdings Inc | 19.43 | 7.16 | 0.50 | 10.09% | $0.26 | $0.9 | 2.91% |
| Sendas Distribuidora SA | 28.37 | 4.34 | 0.30 | 6.63% | $1.42 | $3.07 | 8.35% |
| Pricesmart Inc | 22.70 | 2.36 | 0.57 | 3.42% | $0.08 | $0.2 | 10.59% |
| Average | 23.69 | 4.82 | 0.67 | 5.93% | $2.33 | $8.28 | 4.75% |
th, td { padding: 8px; text-align: left; }
th { background-color: #293a5a; color: #fff; text-align: left; }
tr:nth-child(even) { background-color: #f2f4f8; }
tr:hover { background-color: #e1e4ea; }
td:nth-child(3), td:nth-child(5) { text-align: left; }
.dividend-amount { font-weight: bold; color: #0d6efd; }
.dividend-frequency { font-size: 12px; color: #6c757d; } Through a detailed examination of Costco Wholesale, we can deduce the following trends:
- The Price to Earnings ratio of 50.77 for this company is 2.14x above the industry average, indicating a premium valuation associated with the stock.
- It could be trading at a premium in relation to its book value, as indicated by its Price to Book ratio of 12.64 which exceeds the industry average by 2.62x.
- With a relatively high Price to Sales ratio of 1.35, which is 2.01x the industry average, the stock might be considered overvalued based on sales performance.
- The company has a higher Return on Equity (ROE) of 6.21%, which is 0.28% above the industry average. This suggests efficient use of equity to generate profits and demonstrates profitability and growth potential.
- Compared to its industry, the company has higher Earnings Before Interest, Taxes, Depreciation, and Amortization (EBITDA) of $2.65 Billion, which is 1.14x above the industry average, indicating stronger profitability and robust cash flow generation.
- With lower gross profit of $7.34 Billion, which indicates 0.89x below the industry average, the company may experience lower revenue after accounting for production costs.
- The company's revenue growth of 6.18% exceeds the industry average of 4.75%, indicating strong sales performance and market outperformance.
The debt-to-equity (D/E) ratio measures the financial leverage of a company by evaluating its debt relative to its equity.
Considering the debt-to-equity ratio in industry comparisons allows for a concise evaluation of a company's financial health and risk profile, aiding in informed decision-making.
In terms of the Debt-to-Equity ratio, Costco Wholesale can be assessed by comparing it to its top 4 peers, resulting in the following observations:
- Costco Wholesale exhibits a stronger financial position compared to its top 4 peers in the sector, as indicated by its lower debt-to-equity ratio of 0.36.
- This suggests that the company has a more favorable balance between debt and equity, which can be seen as a positive aspect for investors.
This article was generated by Benzinga's automated content engine and reviewed by an editor.
© 2024 Benzinga.com. Benzinga does not provide investment advice. All rights reserved.