Benzinga - by Surbhi Jain, .
Broadcom Inc. (NASDAQ:AVGO) has been on an impressive upward trajectory, up 100% over the past year and increasing 56% year-to-date. The stock touched a new record high of $1,851.62 on Tuesday. Recent developments and technical indicators suggest that this bullish momentum might continue, though some caution is warranted.
Key Developments Powering the Surge
Broadcom recently made headlines with its Symantec Cloud Secure Web Gateway solution receiving Federal Risk and Authorization Management Program (FedRAMP) authorization. This milestone allows U.S. federal agencies to adopt Symantec’s cloud-hosted security services, facilitating a seamless transition from on-premises data centers to cloud-native services.Additionally, Broadcom's second-quarter financial performance exceeded expectations. The company reported an EPS of $10.96, beating the estimated $10.84, and revenue of $12.487 billion, surpassing the expected $12.028 billion. To top it off, Broadcom announced a 10-for-1 forward stock split, aimed at increasing liquidity and attracting more retail investors.
Also Read: What’s Going On With Nvidia Stock Friday?
Technical Analysis: Bullish Indicators Abound
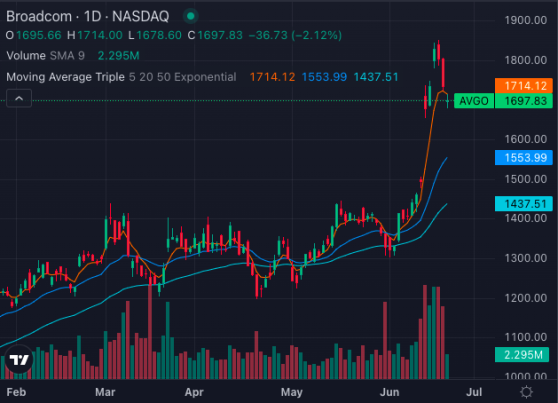
Broadcom’s stock is trading at around $1,700 on Friday, reflecting robust bullish momentum. Here’s a snapshot of the key technical indicators:Chart: Benzinga Pro
- Exponential Moving Averages (EMAs): The stock is trading above its 5, 20, and 50-day EMAs, reinforcing a strong bullish trend.
Chart: Benzinga Pro
- Simple Moving Averages (SMAs): The 8-day SMA stands at $1,679.09, the 20-day SMA at $1,502.19, and the 50-day SMA at $1,393.35, all signaling bullishness.
- 200-day SMA: The stock’s current price significantly exceeds the 200-day SMA of $1,153.81, bolstering a bullish outlook.
Chart: Benzinga Pro
- MACD: The Moving Average Convergence Divergence (MACD) indicator is at 105.16, reinforcing bullishness.
- RSI: The Relative Strength Index (RSI) is at 67.02, with the stock flirting with the overbought zone beyond 70. This indicates the stock may face some selling pressure.
- Bollinger Bands: With the 20-day bands ranging from $1,167.68, the stock remains in a bullish upper band.
A Promising Road Ahead
Broadcom stock continues to demonstrate strong bullish signals, supported by impressive financial results, strategic initiatives, and favorable technical indicators.While the overbought RSI suggests potential short-term corrections, the overall outlook remains positive.
Investors should keep an eye on market sentiment and sector-specific developments as Broadcom navigates its promising path forward.
Read Next: The ‘AI Big 10’: 10 AI Stocks Now Comprise 28% Of S&P 500, Up From 14% In 2023
Photo: Shutterstock
© 2024 Benzinga.com. Benzinga does not provide investment advice. All rights reserved.
Read the original article on Benzinga
