
- How much is CPI, and how much is the trend formulating Fed-hike expectations?
- I may deepen my S&P 500 target to 2,700
- Downward trajectory of dollar, gold interrupted
- Oil bulls face bearish standoff
- Bitcoin may be gearing up for another drop to $10K
- Any company’s financials for the last 10 years
- Financial health scores for profitability, growth, and more
- A fair value calculated from dozens of financial models
- Quick comparison to the company’s peers
- Fundamental and performance charts
Once again, investors are driving up beleaguered technology stocks and mega-caps on the outlook that inflation is peaking.
Two weeks ago, I argued that the short-term trend impacts expectations about a dovish Fed pivot.
Source: Investing.com
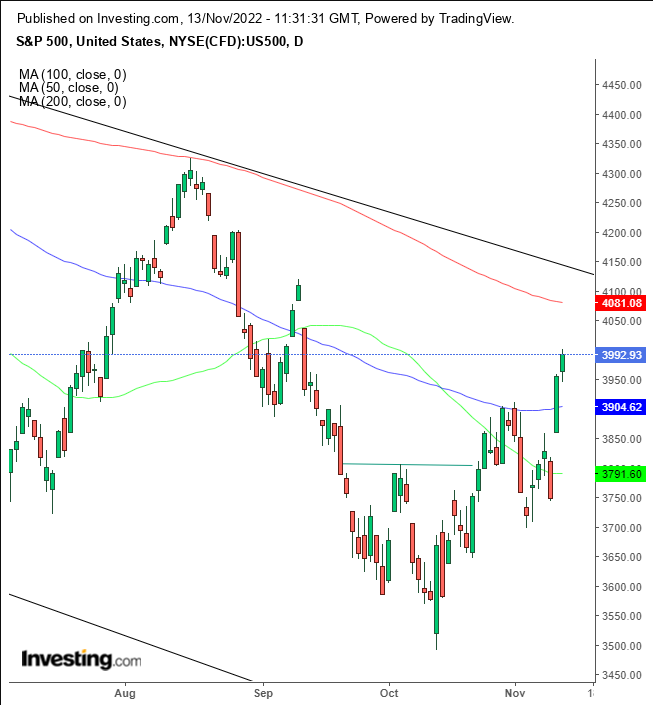
I've observed that "the risk-on, risk-off" narrative correlated with the short-term swings within the downtrend, the so-called "Fed pivot" drummed up since the summer lows that repeated itself with each bounce, after the S&P 500 bottomed in the short term.
Still, while the benchmark crossed above the 50 and 100 DMAs, it is below the 200 DMA. The latter reinforced the falling channel top, resisting the price in August. Will it do the same again? Naturally, I couldn't tell you. However, the medium term is down until proven otherwise. Also, although the price scaled above the short-term MAs, the relationship is bearish, as the 50 DMA languishes below the 100 DMA.
Source: Investing.com
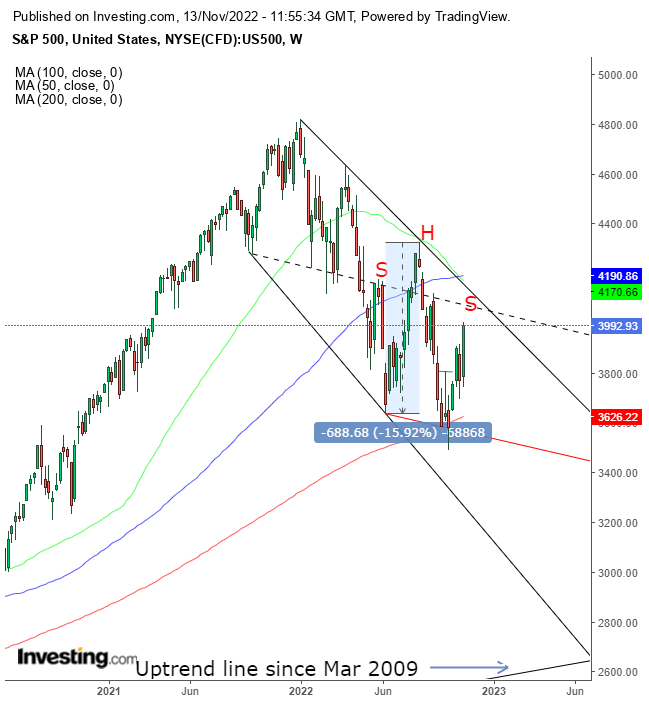
In the weekly view, we discover that the rally is in the short term, but stocks are still falling in the medium term. In other words, the current rally is a correction within a downtrend.
I noted in the article on Oct. 23 that the medium term includes short-term rallies, as it has done so since the Jan peak. Sometimes it pays to take a step back and see the bigger picture.
To clarify, I do not know if it will not bottom this time. I do know that, as of now, it's nothing more than a correction. If the weekly peaks and troughs reversed, I would say, "OK, now, we have a bottom."
Remember the head-and-shoulders top that initially turned me bearish? Note the current price structure since May, after the H&S top, has again been in an H&S pattern with a downward-sloping neckline, only this time of the "continuation pattern" variety. See how the first H&S neckline has resisted the S&P 500 as it forms the current potential H&S.
On Aug. 25, I made a call that I expected the S&P 500 to head to 3,000 points, which I reiterated on Sep 19. However, if my 3,000 calls are realized, I will have to up the ante. The price will have completed an H&S continuation pattern, which based on its height implied a target of almost 700 points from completion - which is difficult to gauge given that the neckline is sloping precisely. Roughly speaking, if we estimate that the pattern will complete at 3,400, an approximate move of 700 points will target the 2,700 level. And if that follows through, the price will retest the long-term uptrend line since the March 2009 bottom.
The tech-heavy Nasdaq 100 surged 8.84% last week, compared with the S&P 500's 5.9% in its sharpest weekly rally of the year. While that's exciting, I reiterate: As long as the weekly peaks and troughs are in a downward formation, I have no choice but to consider the current rally to be a correction before stocks head lower. It bears mentioning that bear-market rallies are the most powerful ones because they are going against the main trend amid short coverings. This market phenomenon became even more powerful after polls made bears overconfident in a Republican takeover, which would have stopped Democrats' ongoing spending and tax hikes.
Thursday's aggressive equity rally after better-than-expected CPI data was a relief rally. However, the inverted yield confirms that it isn't sustainable.
The next big data focus is retail sales. It could be what makes or breaks the short-term rally. Robust retail data will make it difficult for the Fed to ease on rates and force it to remain aggressive, as it would suggest that inflation will keep rising.

Source: Investing.com
The 3-month and 10-year Treasury yields are inverted. Since 1982, every inversion has been a leading indicator of an equity decline sometime in the following year.
The 2- and 10-year yield spread has been inverted since July, and last week, the 2-year fell 58.6 basis points below the 10-year yield for the first time since the 1980s, when former Fed Chair Paul Volcker's aggressive hikes pushed the economy into a recession.

Source: Investing.com
The renewed search for risk caused the sharpest dollar selloff in years. The softer CPI data prompted the Japanese yen to its most significant intraday climb since 2008, and the pound enjoyed the strongest daily rally since 1985, when the pound had reached its lowest level ever before it notched a new all-time low of $1.03 on Sept. 26.
The reversal blew out a falling wedge, disrupting its earlier trajectory. Falling yields dragged down the greenback after it had risen more than 16% in value this year.
Fed funds futures prices fell below 5%, as bets rose to 71.5% that the December Fed hike will be just 50 basis points, rather than the recent new normal of jumbo 75-basis-point hikes.
Conversely, gold has bottomed out, as traders eventually reprice the presumed lower rate than expected. Like the dollar, gold is going against my current call, for now.

Source: Investing.com
Bitcoin is languishing at the $16,000 level as $3 billion escaped crypto exchanges this week amid a bank run on fears of an FTX contagion. The triangular range since Nov. 9 could turn out to be a pennant, a continuation pattern indicating a repeat performance, targeting the $10K level, in line with my long-term bearish call since January.
Crude Oil WTI Futures jumped Friday, easing a weekly decline, as China eases coronavirus restrictions in what is seen as a potential demand increase. However, bulls have to overcome a line of selling.

Source: Investing.com
Oil has been attempting but failing to climb over the $94 level since falling below it in August. That line represents sellers, making up the bottom of a descending triangle. However, if there is a supply-demand conversion, bulls will have completed an H&S base, which will retest the falling trend, which could prove a falling channel top.
Disclosure: At the time of publication, the author had no positions in the securities mentioned.
***
Looking to get up to speed on your next idea? With InvestingPro+ you can find
And a lot more. Get all the key data fast so you can make an informed decision, with InvestingPro+. Learn More »