As we discussed last week, the coronavirus helped to cause an increase in inflation to 5.4% vs 4.9% expected, as much of the inflation was due to higher food prices. Yesterday, China released data suggesting they have been flooding the market with liquidity, trying to keep the economy afloat while also trying to navigate through this natural disaster.
New Yuan loans for January increased to CNY 3340B vs CNY 3000B expected and CNY 1140B last!! In addition, Total Social Financing for January increased to CNY 5070B vs CNY 4300B expected and CNY 2103B last!
The amount of new funds provided in January was almost double the amount from December. This should have been a major bullish sign to the markets, indicating that China was willing to do what was necessary to reduce the collateral damage from the slowdown of the coronavirus. USD/CNH was up .44% yesterday, although stocks markets weren’t impressed.
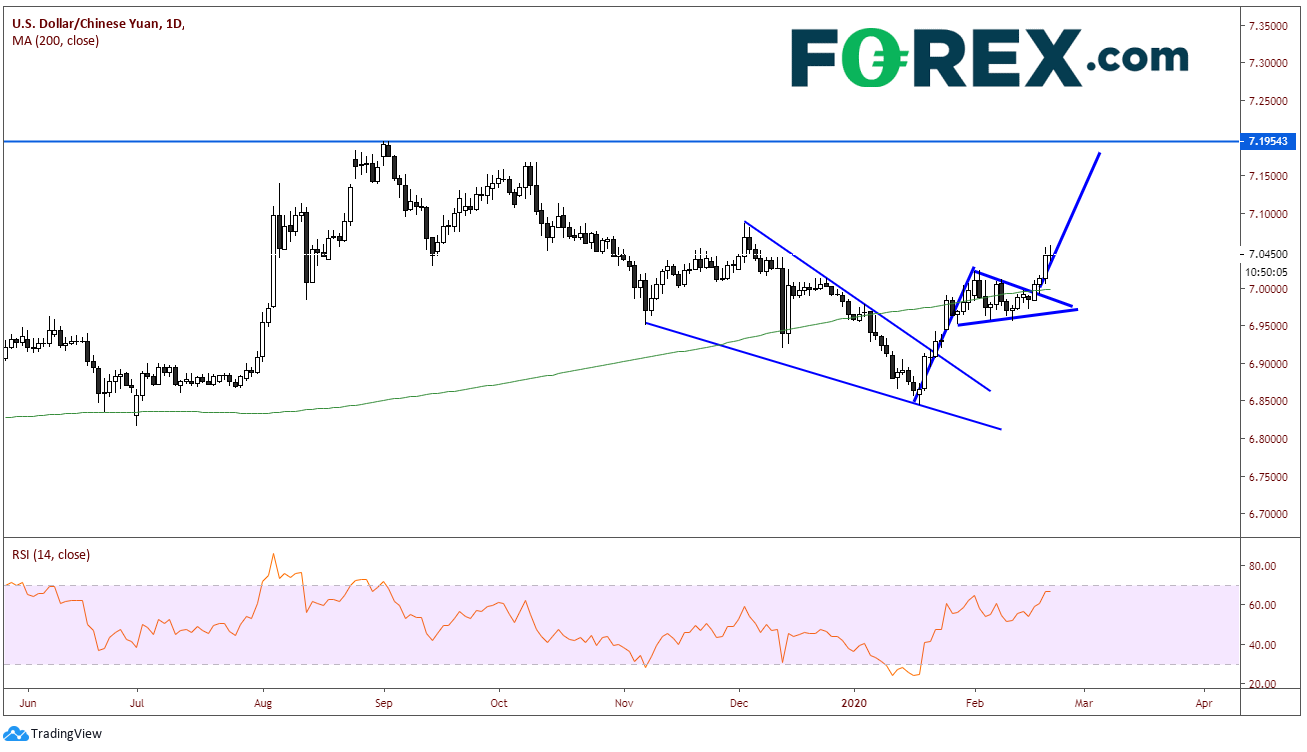
Technically, the move higher in USD/CNH was foreshadowed by a pennant formation dating back to the hammer bottom on January 20th. On January 22nd, price broke higher out of falling wedge. The target for a falling wedge is a 100% retracement of the wedge, which is near 7.0850. As USD/CNH began moving higher, it stalled near the psychological 7.0000 big round number and the 200 Day Moving Average, formatting a pennant. On Tuesday, price moved higher out of the pennant, and with news of the fresh supply of funds from China yesterday, price moved convincingly higher from 7.0129 to 7.0548 (more supply weakens the price of Yuan). The target for the pennant is near 7.18, very close to the highs from September 2nd , 2019 at 7.1954.

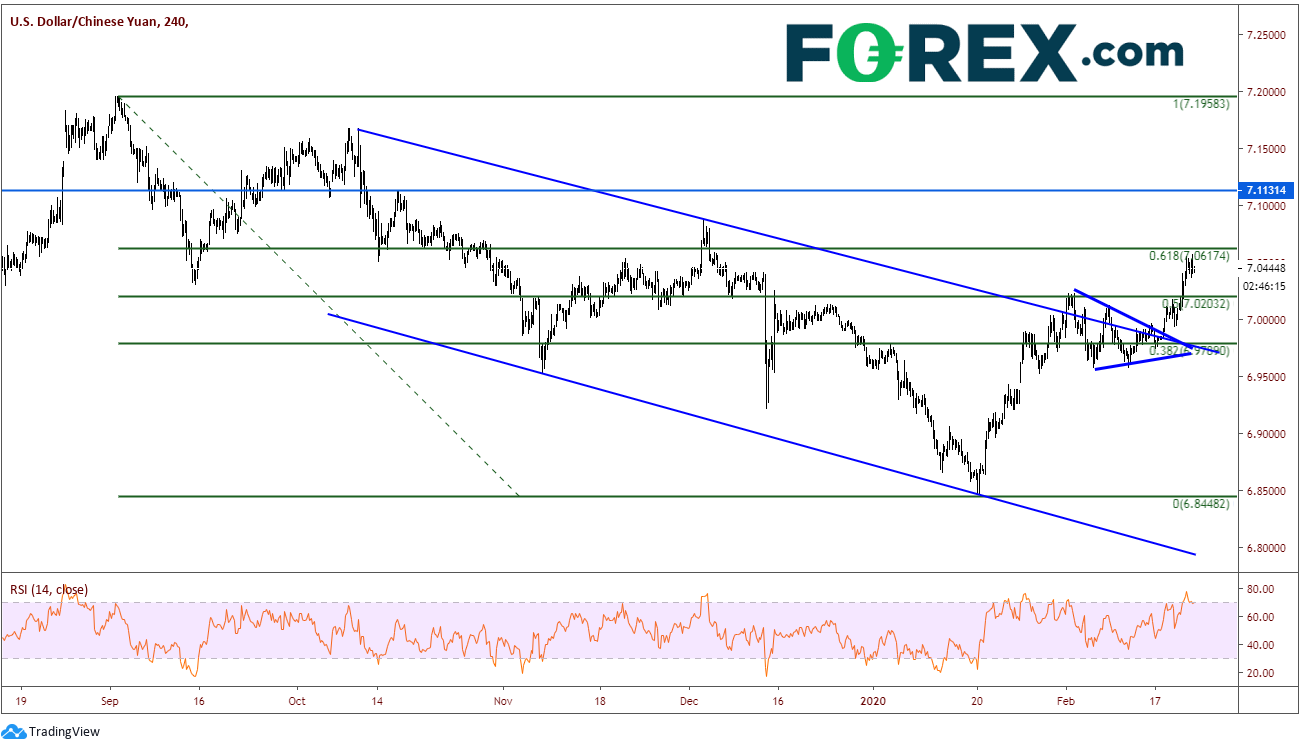
On a 240-minute timeframe, price is consolidating today just below the 61.8% retracement level from the highs of September 2nd, 2019 to the lows on January 20th. This level is first resistance at 7.0617. The pause in the uptrend is also allowing for the RSI to unwind back into neutral territory. Above there is horizontal resistance near 7.1131 and finally the September 2nd highs at 7.1958, which is near the target from the pennant on the daily timeframe. First support is 7.0200, which is not only the highs of the pennant pattern, but also the 50% retracement level of the entire move and very close 7.0000. Below that is support from the upper descending trendline of the flag and a downward slowing trendline dating back to mid-October 2019, near 6.9700. Although there is a small gap to be filled between 6.9385 and 6.9452, price could fall near the January 20th lows at 6.8448 if we begin to see positive developments in the coronavirus story line.

If the coronavirus continues to spread throughout China and manufacturing remains shut down (some are saying until March 11th), USD/CNH should continue to rise and move towards the pennant target. However, if there is good news over the next few weeks, USD/CNH could be back near the January 20th lows.
