Market Overview
Risk appetite took a knock on Friday as everyone’s perception of the recent upswing in the cycle of the trade dispute was given a shot across the bows. The playbook of the trade dispute has been that the two sides exchange pleasantries in the run up to face to face talks. China has deviated slightly from this path, in pulling of some scheduled visits to US farms in Montana. This could be a sign that perhaps China and the US are not all that close to an agreement. Subsequently, risk appetite has come under renewed negative pressure. Treasury yields lower, gold and the yen strengthening, whilst the Aussie was hit and Wall Street also slipped.
It was interesting to see China looking to calm the waters again over the weekend by claiming that “constructive” talks were held between trade deputies of the two countries. However, this should serve as a warning that complacency in the run up to planned October meetings between top level trade delegates. Just like a feral pet, it always has the ability to turn when least expected. There is an air of caution this morning across markets. Traders appear wary with cautious positivity, but they have been warned.
Wall Street closed lower into Friday’s close (S&P 500 -0.5% at 2992) but a rebound on US futures of +0.4% early today hints at a bounce back. With the Nikkei closed for a Japanese public holiday, Asian markets were mixed to slightly weaker (Shanghai Composite -1.4%). European markets are also mixed in early moves, with FTSE futures +0.1% and DAX Futures -0.2%. In forex, the majors are showing mixed performance against USD, with AUD and NZD rebounding slightly after recent weakness, whilst JPY is the main underperformer.
In commodities, the mild pick up in risk is hitting gold back by -0.1% and silver is rebounding well over a percent higher. Oil is starting the week on solid ground over a percent higher.
The flash PMIs for September are the big focus on the economic calendar today. The early European session is packed with French and German data, with the Eurozone wide data released at 0900BST. Eurozone flash Manufacturing PMI is expected to show signs of mild improvement but still at a contractionary 47.5 (from a final 47.0 in August). The Eurozone flash Services PMI is expected to slip back to 53.3 (from a final 53.5 last month), which should mean little real change to the composite number which was at 51.9 last month.
Into the US session, the US Flash Manufacturing PMI is at 14:45 BST and is expected to drop back to a hair’s breadth in expansion at 50.1 in September (down from 50.3 in August). The US flash Services PMI is expected to improve to 51.2 (up from 50.7 last month) which should help to improve on the rather tepid 50.7 composite PMI reading from August.
Chart of the Day – AUD/JPY
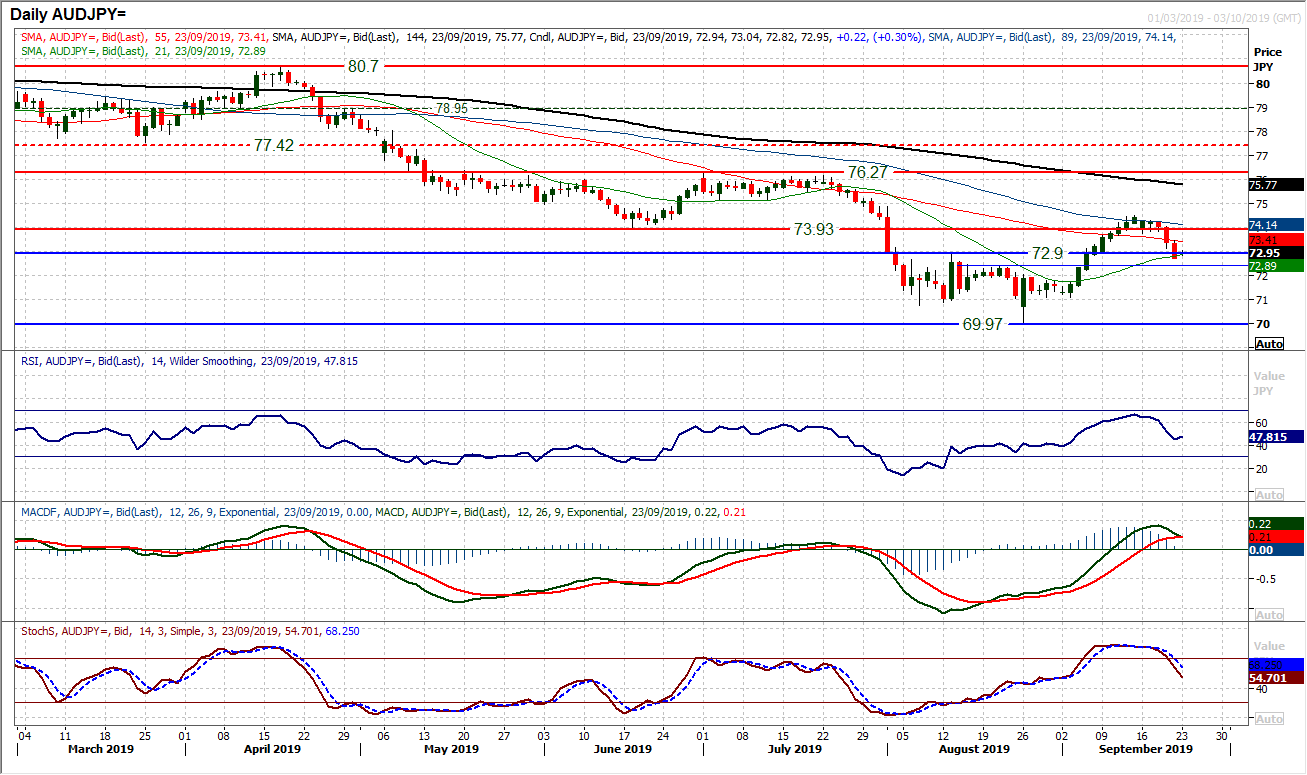
There has been an ebb and flow of performance on Aussie/Yen and now it seems that Australian dollar underperformance is coming to the fore again. This comes as AUD/JPY has swung lower and is now posting a series of sell signals just as a key band of support is tested. The old breakout band between 72.40/72.90 is under pressure. Two successive strong negative candles means that the bears come into the new week in the ascendency and a sense of rallies being a struggle. Subsequently, how the market responds to this morning’s early rebound could be key. Daily momentum indicators are now gathering pace, with a confirmed Stochastics sell signal, whilst MACD lines are close to joining them and RSI is accelerating lower. Furthermore, hourly indicators are also negatively configured. This all suggests that rallies are now a chance to sell. The hourly chart shows resistance 73.15/73.50. A closing breach of 72.40 would reopen the next support at 71.20 and the key August low at 69.97.
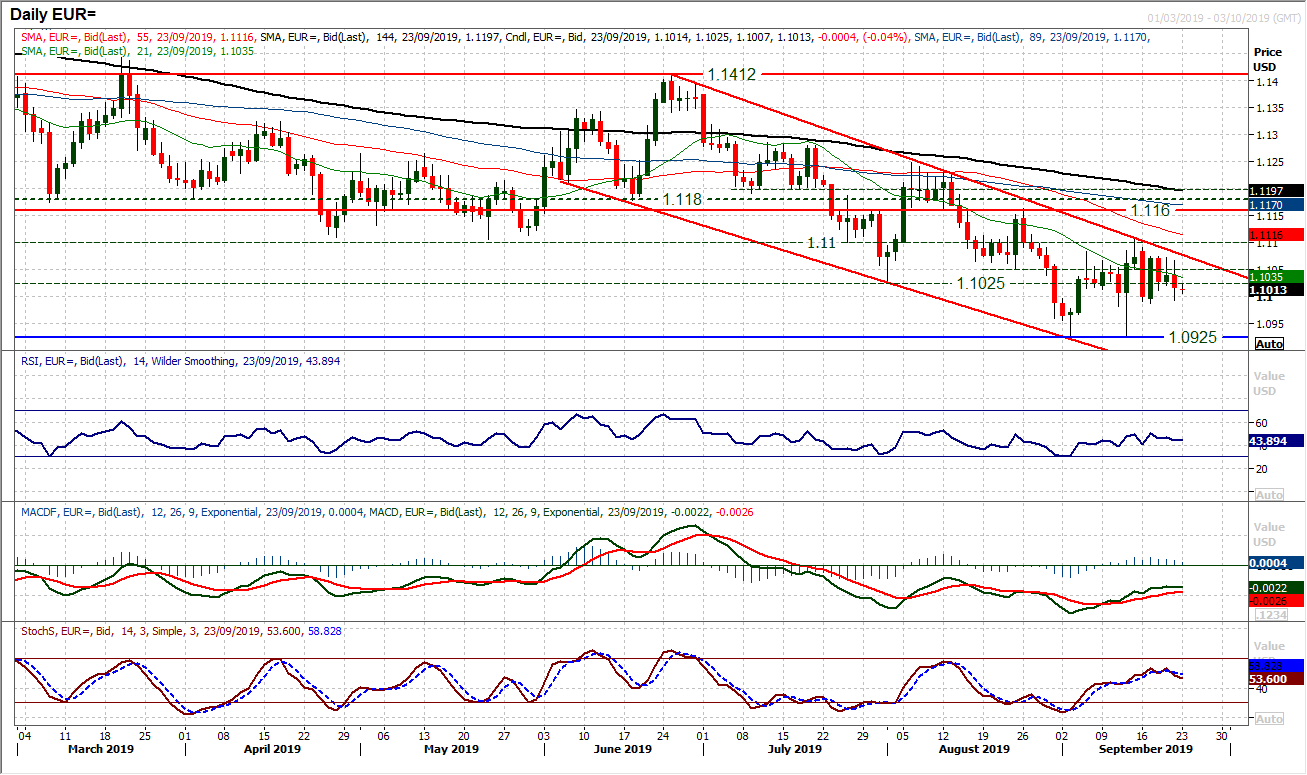
The consolidation of the past couple of weeks is now beginning to have to contend with the resistance of the approaching downtrend channel (which today comes in at $1.1080). In the past few months, rallies have continually struggled for traction. This is shown as the momentum indicators consistently fail around the neutral areas, with RSI unable to breach 50 and MACD lines faltering under neutral. As the recent September rally failed around $1.1100 the market is now beginning to drift back. As a broad gauge, $1.1000 is an area that the bulls are looking to defend on a closing basis, but it is being consistently tested. A close under $1.1000 with the RSI below 40 would suggest the traction is building lower once more. A test of $1.0925 would then be likely. A close above $1.1100 is needed to shift the outlook.
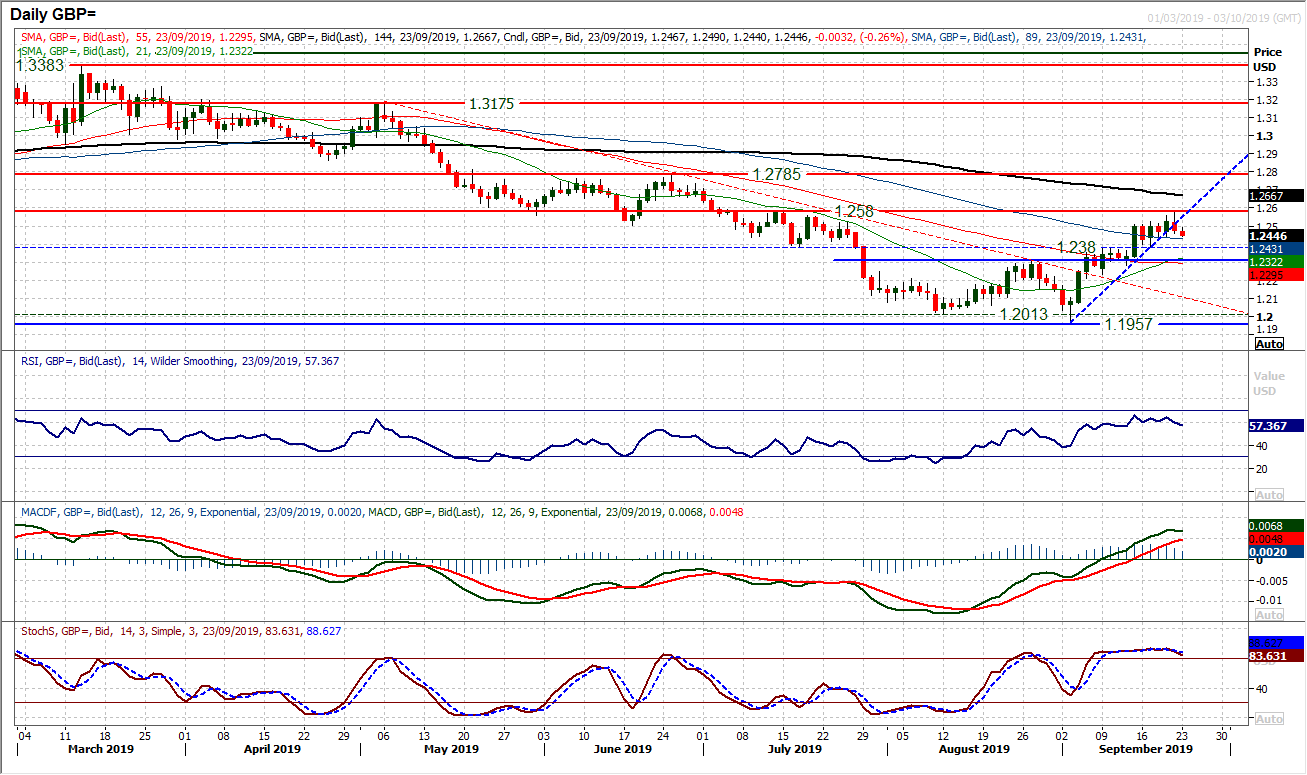
The loss of bullish momentum has just seen the bull trend of the past three weeks now being breached. This is not terminal for the bull control but it does suggest that the strength of the run higher has waned. A run of contradictory candlesticks in the past six sessions is reflective of this as Friday’s initial move to multi-week highs was pegged back. The resistance at $1.2580 was hit almost bang on before the bull run was pared. However, we continue to expect weakness to be bought into, with good support $1.2305/$1.2380. A slight slip away on momentum is just a shade of caution to the outlook, but nothing overly concerning for the bulls quite yet. The hourly chart shows a continued run of higher lows and weakness bought into, something we expect to continue. Initial resistance at $1.2520 with resistance at $1.2580 still key.
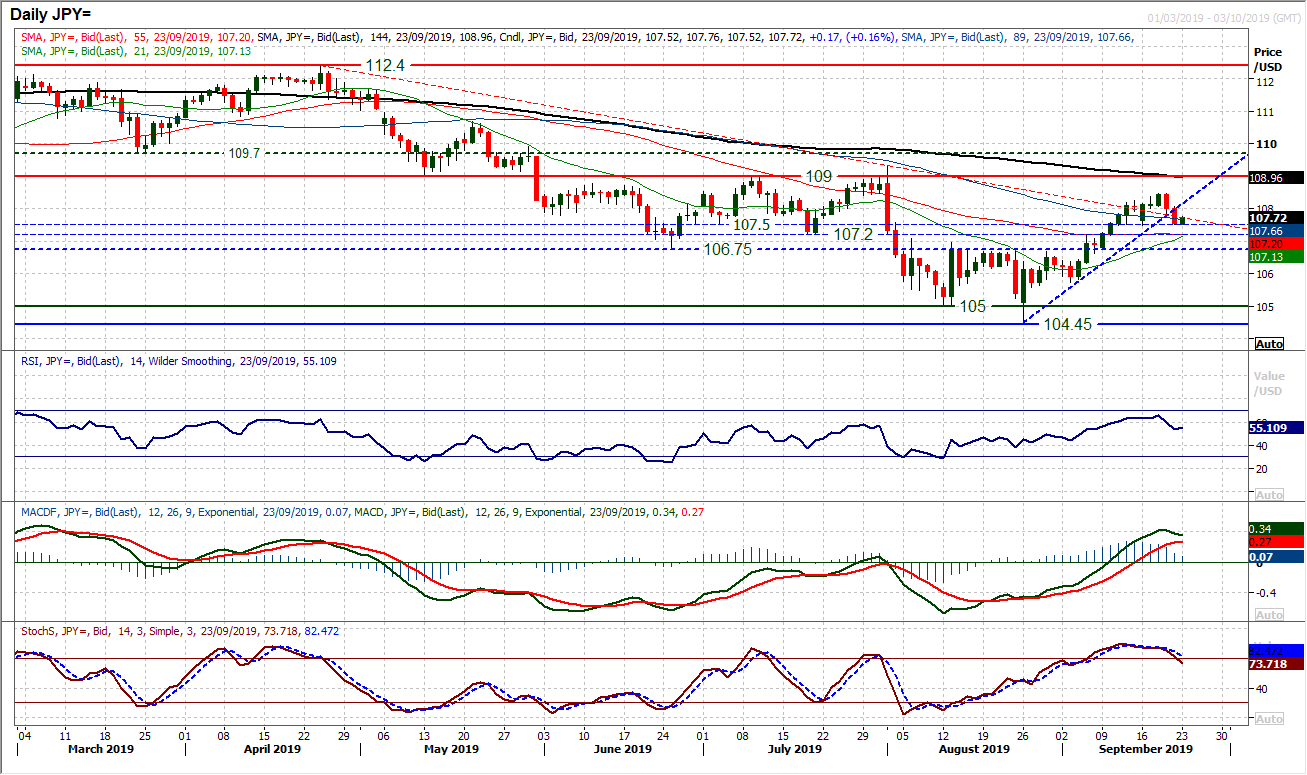
The near four week uptrend was breached by a second bear candle on Friday, to question the bull control. However, once more the key pivot band 106.75/107.50 is the key technical factor. The fact that the 107.50 support has held (almost to the pip) will have come as a relief for the bulls. However, momentum indicators are now looking far less positively configured now as the Stochastics roll over (threatening a confirmed near term profit-taking signal). Despite this, for now, the MACD lines have just lost impetus rather than posting any sell signal, whilst RSI is also holding above 50. We still continue to see corrections as a chance to buy and there is good support that continues to hold at 106.75/107.50. The hourly chart shows resistance initially 107.75/108.00 needs to be breached to shift the momentum positively again. This would be confirmed with the hourly RSI above 60 again.
Gold
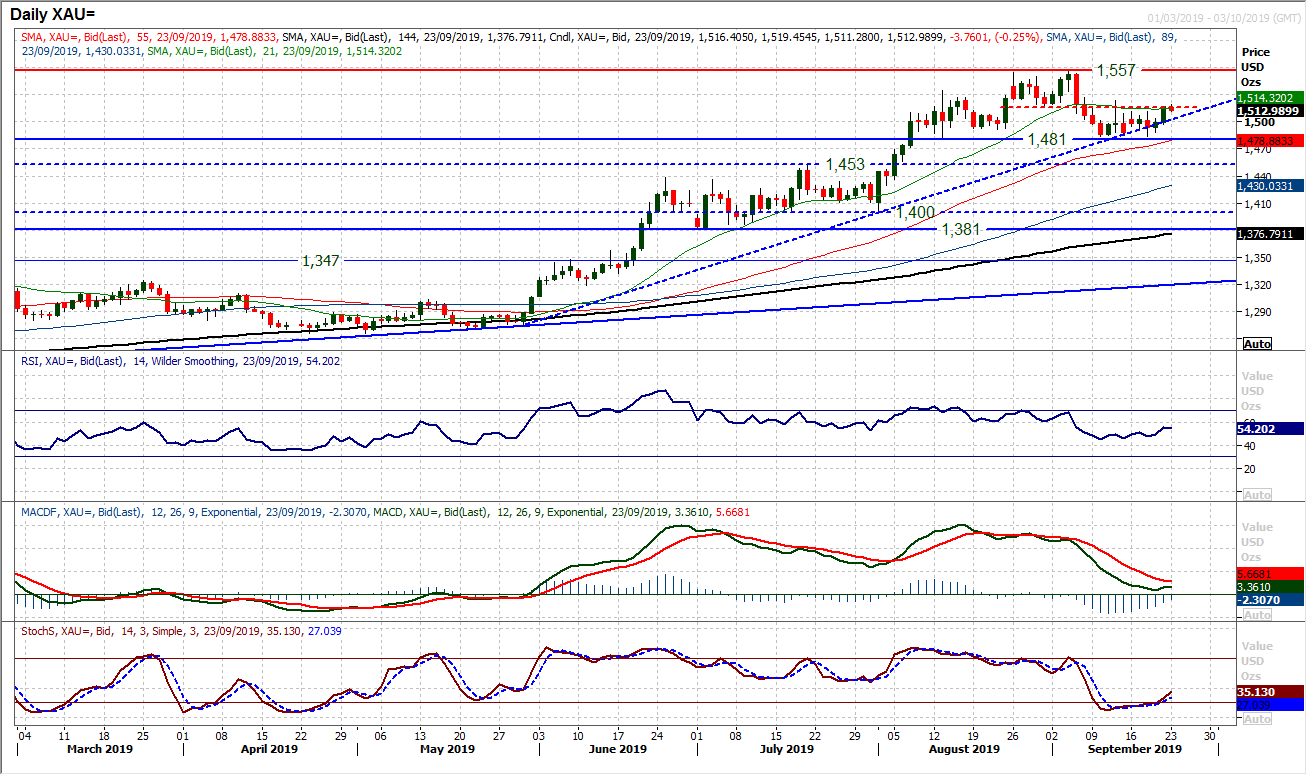
After a period of consolidation in the past couple of weeks the bulls have just started to come back to the fore once again. The resistance of the $1484/$1517 (what we see as a “neutral zone” for gold) is being tested. The most significant implication of this would be that a closing upside breach would once more see the bulls back in control. Encouragingly for the bulls, the momentum indicators seem to be looking to lead the market higher in this move. RSI is rising above 50, whilst the Stochastics are advancing above 20 again and MACD lines are looking to bottom out and turn higher from neutral. A close back above $1517 would be back above the 21 day moving average again and another aspect of positive development. It would also re-open the resistance of the highs again at $1557. There is initial support now building on the hourly chart $1498/$1511.
WTI Oil
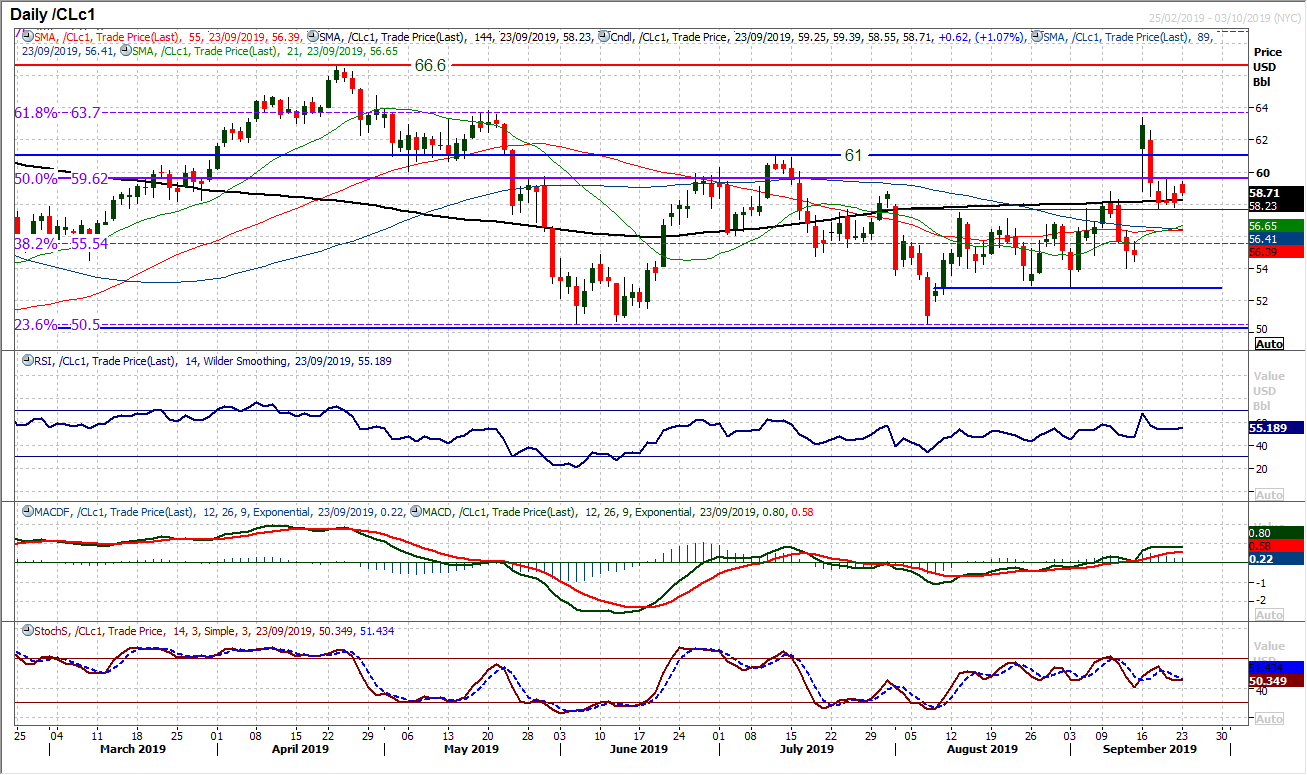
The oil price has settled in recent sessions as the shock spike higher has had a retracement. It is interesting though that the market appears to have given a degree of geopolitical risk premium to oil. The gap at $55.70 remains wide open and unfilled. Support at $57.65 is begging to build now. It does appear that the old 50% Fibonacci retracement at $59.60 from the 2018 sell-off $76.90/$42.35 is still playing a key role, currently as a basis of resistance. Closing above $60 would lend a renewed positive traction, whilst below $57.65 renews the negative drift.
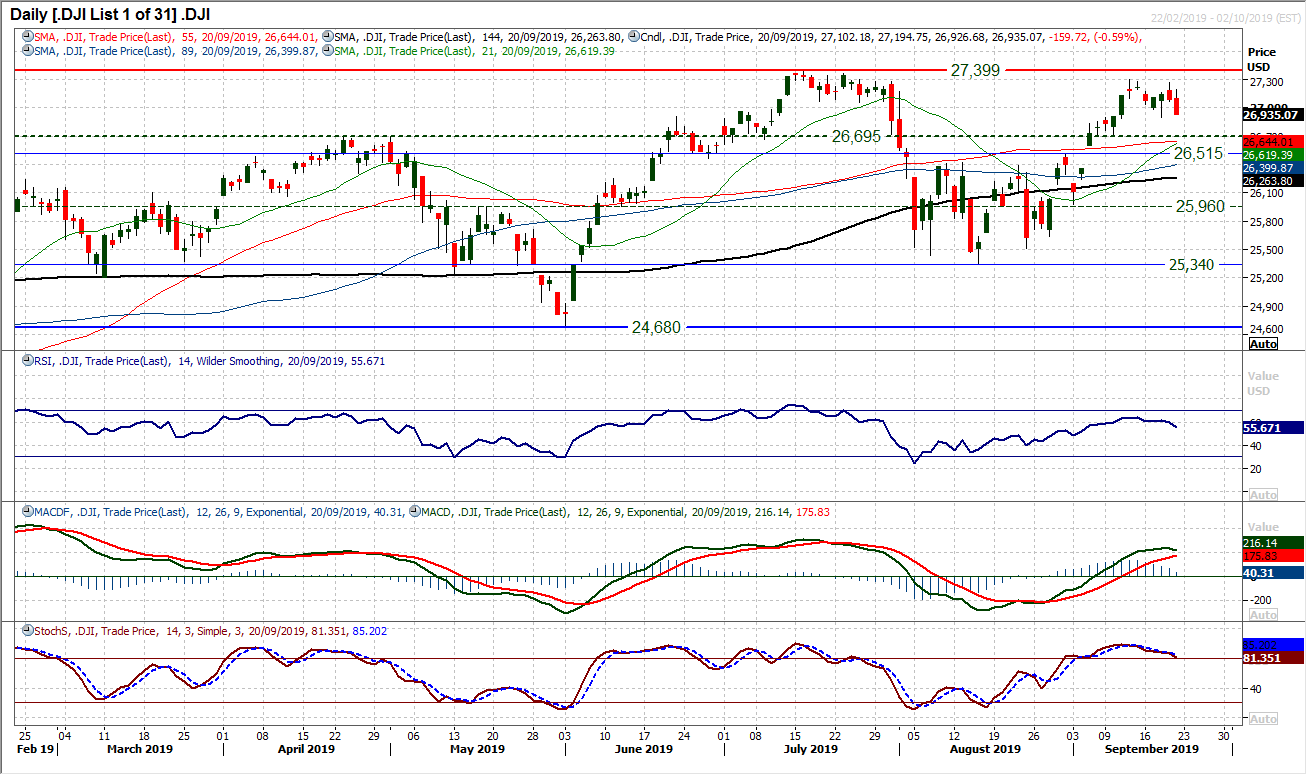
A couple of decisively negative candles has the bulls on the back foot once more. Friday’s close at the low of the session means that the reaction of the bulls to any intraday strength today could be key. Futures are looking initially positive, but if this rebound quickly falters then the Dow could be looking at a test of the 26,899 low. If breached this would mean a lower high and a lower ow formation in the past two weeks. Whilst not key lows, this may begin to see a new trend formation. Momentum is also important here, with the MACD lines threatening to cross back lower. If there are confirmed bear signals on Stochastics (below 80) and RSI (falling below 50 initially) along with a bear cross on MACD, then it would point towards pressure on 26,515/26,695. Initial resistance today at 27,195.
"""DISCLAIMER: This report does not constitute personal investment advice, nor does it take into account the individual financial circumstances or objectives of the clients who receive it. All information and research produced by Hantec Markets is intended to be general in nature; it does not constitute a recommendation or offer for the purchase or sale of any financial instrument, nor should it be construed as such.
All of the views or suggestions within this report are those solely and exclusively of the author, and accurately reflect his personal views about any and all of the subject instruments and are presented to the best of the author’s knowledge. Any person relying on this report to undertake trading does so entirely at his/her own risk and Hantec Markets does not accept any liability. """
