
- All Instrument Types
- Indices
- Equities
- ETFs
- Funds
- Commodities
- Currencies
- Crypto
- Bonds
- Certificates
Please try another search

Templeton Emerging Markets IT: Proactive Board Seeking to Lower the Discount

Templeton Emerging Markets Investment Trust’s (TEMIT’s) board is frustrated by the company’s persistently wide discount so it has announced a series of measures aimed at increasing demand for the trust’s shares. These are an acceleration in share repurchases, a commitment to at least maintaining the current annual dividend, a conditional 25% performance-related tender offer and a phased reduction in management fees. TEMIT’s two managers, Chetan Sehgal (lead manager) and Andrew Ness, remain positive on the outlook for emerging markets and consider that the general lack of appreciation of their prospects is providing a good opportunity for global investors. Emerging markets offer the potential for above-average growth with attractive absolute and relative valuations.
Why consider TEMIT?
TEMIT’s board does not believe that the trust’s valuation reflects its strong performance and has therefore increased the scale of returns to investors via a combination of share repurchases, dividends and a conditional tender offer, along with a reduction in management fees.
The trust’s managers seek to capitalise on long-term structural opportunities by identifying companies with sustainable earnings power that are trading at a discount to their intrinsic worth; hence, TEMIT could be considered as a ‘quality value’ fund.
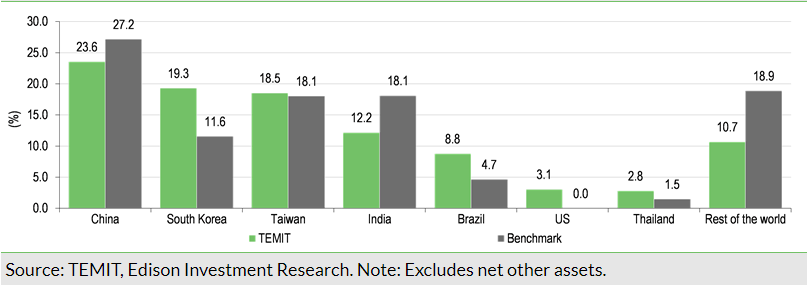
Sehgal and Ness believe that emerging markets offer an attractive opportunity for investors as they consider they are under-owned, underestimated and undervalued. The managers are not constrained by benchmark allocations, evidenced by an overweight exposure to South Korea and underweight positions in India and China, while the sector variances versus the index imply that the fund is positioned for an economic recovery.
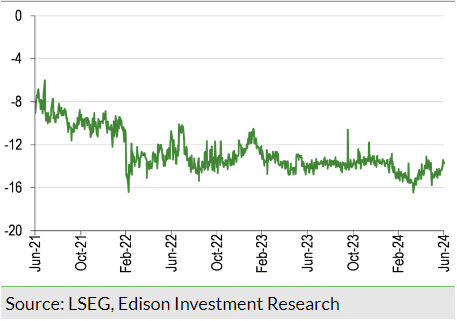
Investment company discounts are generally wider than average during a period of economic uncertainty. TEMIT is not immune from this trend as its current 13.7% discount is towards the high end of the 5.8% to 16.5% three-year range and wider than the company’s average discounts over the last three, five and 10 years.
- NOT INTENDED FOR PERSONS IN THE EEA
TEMIT: Deep resources provide competitive advantage
TEMIT (LON:TEM) is by far the largest London-listed emerging markets fund. Its two managers are part of a team of more than 70 investment professionals with research coverage of over 700 securities. Franklin Templeton has been investing in emerging markets for more than 35 years and considers that its local presence in 14 countries around the world is a competitive advantage in terms of building relationships and gaining valuable insights, including identification of investment opportunities that may be overlooked by other emerging market investors.
From TEMIT’s launch in June 1989 to the end of FY24 (31 March 2024), the trust’s +4,155.4% NAV total return has significantly outpaced the benchmark’s +1,752.0% total return.
Recent corporate development – aiming for a higher valuation
On 4 June 2024, ahead of the release of TEMIT’s FY24 results, the board announced a series of initiatives aimed at increasing demand for the trust’s shares:
- An increase in share repurchases via a buyback programme of up to £200m over the next 12–18 months, which is equivalent to up to 10% of current net assets.
- To at least maintain the current 5p per share annual dividend for the next five years (£278m based on the shares outstanding at the end of March 2024).
- A performance-related conditional tender offer measured over the next five years for 25% of the shares outstanding (equivalent to £498m of NAV, 16.2% of market cap at end-FY24).
- A phased reduction in management fees over the next two years.
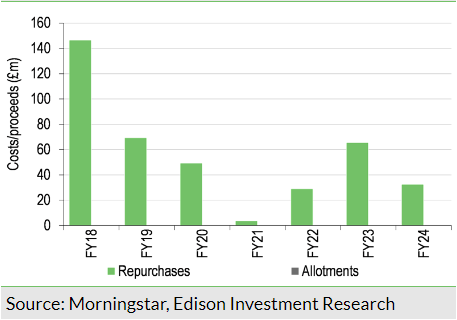
Information about these initiatives is included in the relevant sections in this report. The board aims to provide investors with increased confidence that TEMIT will generate value either from strong performance, returning cash to shareholders, lower costs or an ability to exit close to NAV via a conditional tender offer. Over the last five financial years, a total £467.2m was returned to shareholders via dividends and share buybacks (equal to 22.1% of net assets at the start of the period, and would have been up to 45.6% if the prior tender offer had been triggered).
Why emerging markets?
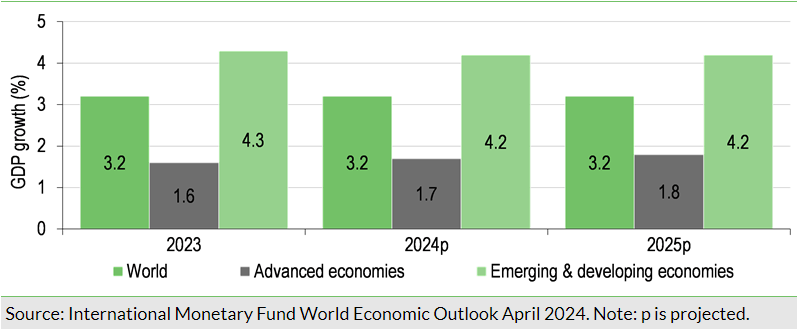
Emerging markets have above-average growth prospects (see front-page chart) helped by long-term trends including favourable demographics, increased urbanisation and a rising middle class. More recently, following supply chain disruptions during COVID-19, companies are diversifying their supply chains, which is benefiting countries such as Mexico and Vietnam. For more information about emerging markets, please see our June 2024 emerging markets thematic report.
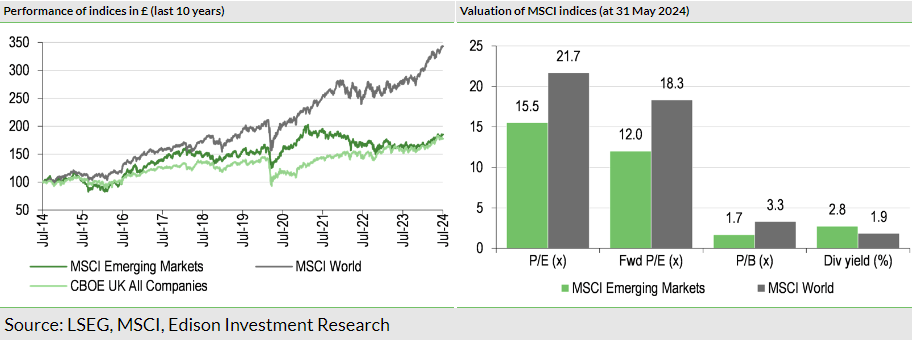
Over the last decade, emerging markets (and the UK) have significantly lagged the performance of global equities (Exhibit 1, left-hand side). However, a large part of this is due to the outperformance of the US, which dominates world indices (c 71% of the MSCI World Index). Emerging markets continue to look relatively attractively valued (Exhibit 1, right-hand side). On a forward P/E multiple basis, at the end of May 2024, the MSCI Emerging Market Index was around 35% less expensive than the MSCI World Index and also offered a higher dividend yield.
Emerging market perspectives from Sehgal and Ness
Although the relative performance of emerging markets in recent years has been disappointing, the managers still have confidence in their long-term growth prospects. They cite attractive demographics, rising investment creating higher-paid jobs and increased consumption. The United Nations projects a greater than 25% addition to the global population to 9.2bn by 2050, with the majority of the increase occurring in emerging markets. Rising middle classes in these regions, helped by the ongoing trend towards urban living, are driving higher demand for both goods and services.
Sehgal and Ness highlight that the quality of emerging market companies has increased over the last 15 years, with a significant shift from old to new economy businesses. For example, the regions are home to some of the leading companies involved in renewable energy, battery storage systems and artificial intelligence (AI). Supply chain concerns and increased geopolitical tensions are reshaping the global landscape, with US, EU and Japanese multinational companies bringing their manufacturing operations closer to home (nearshoring) or relocating them in allied territories (friendshoring).
The managers believe that potential interest rate cuts and better earnings growth for 2024 are tailwinds for emerging markets. Although interest rates have been higher for longer, moderating inflation means that central bank monetary policies are likely to ease. The Chinese authorities are working hard to stimulate the Chinese economy and deal with the property sector overhang. However, Sehgal and Ness are mindful of growth headwinds, including the conflicts in Gaza and Ukraine and elevated tensions between the US and China.
Growth in AI has been an important development for some of the emerging market countries such as South Korea and Taiwan, as many of the semiconductor and hardware companies that cater to the AI industry are based in Asia. The managers believe that advances in semiconductor chips mean that AI will be a structural growth theme as it becomes more widely adopted in both corporate and consumer applications.
Current portfolio breakdown
TEMIT offers investors a broad and differentiated emerging markets exposure. At 31 December 2023 there were 78 holdings in the portfolio; 41 distinct names, representing 31% of the portfolio, were not held by its major peers. Also, the fund had 28 names that are not represented in its benchmark, which made up 18% of the portfolio. By the end of May 2024, the number of portfolio holdings had increased by five to 83.
In H224, the largest new holding in the portfolio was SK Hynix, which is a South Korean semiconductor company. Other purchases included Hypera (pharmaceuticals) and Oncoclínicas do Brasil Serviços Médicos (oncology and radiotherapy services) in Brazil, South African financial services company Discovery and Minor International Public Company, which is a Thai consumer discretionary firm with hospitality, restaurant and lifestyle businesses.
There were a few complete disposals from the portfolio in H224: China-listed Tencent (HK:0700) Music Entertainment Group, which operates online music entertainment platforms; India-listed PB Fintech, which provides online insurance and lending products; and two South Korean names, chemical company LG Chem and L&F, which produces materials used in electric vehicle batteries. The managers have been reducing the trust’s exposure to the electric vehicle supply chain due to a material slowdown in near-term growth expectations.
At the end of May 2024, TEMIT’s top 10 holdings came from a range of countries and sectors and made up 46.8% of the portfolio, which was a higher concentration versus 45.6% 12 months earlier.
The trust has exposure across the market cap spectrum. At end-May 2024, the portfolio was broken down as follows: market cap above $50bn (c 51%); $25–50bn (c 7%); $10–25bn (c 14%); $5–10bn (c 10%); $2–5bn (c 12%) and less than $2bn (c 6%).
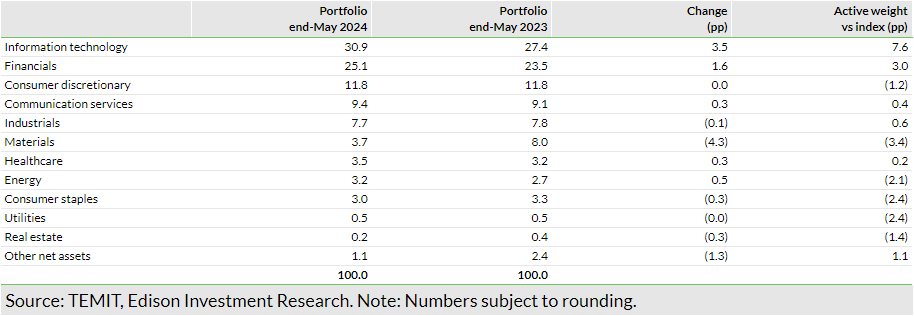
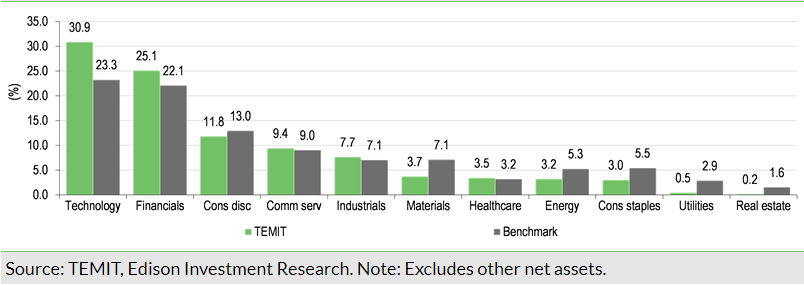
Portfolio geographic and sector breakdowns are a result of bottom-up stock selection. Over the 12 months to the end of May 2024, the largest changes in the trust’s sector exposure were a lower weighting in materials (-4.3pp) and a higher allocation to IT stocks (+3.5pp); this sector was also the largest active position versus the index (+7.6pp).
In terms of geography, in the 12 months to the end of May 2024, the largest change was a lower allocation to China (-2.1pp), with larger weightings to the rest of the world (+2.1pp) and Taiwan (+2.0pp). There was an overweight exposure to South Korea (+7.7pp) partly due to the country being a beneficiary of the growth in AI, while India was underweight (-5.9pp) versus the index on valuation grounds.
Performance: NAV ahead of benchmark in FY24
While there are 11 funds in the AIC Global Emerging Markets sector, in Exhibit 7 we have excluded the specialist funds to provide a more relevant comparison.
TEMIT is by far the largest of the generalist emerging market funds. Its NAV total returns are below average over the periods shown. The trust’s closest peers according to Sehgal and Ness are Fidelity Emerging Markets (FEML) and JPMorgan (NYSE:JPM) Emerging Markets Investment Trust (JMG). Of the three funds, TEMIT has the best NAV total returns over the last three and five years, with FEML ranking first over the last 12 months and JMG in first place over the last decade.
In an environment of above-average risk aversion, all the funds in the selected peer group are currently trading at a discount; TEMIT’s is the widest. The trust has an average ongoing charge, and in line with most of its peers no performance fee is payable. TEMIT is one of four funds that is currently ungeared. The trust has the second highest dividend yield, which is 1.2pp above the mean of the selected peer group.
In FY24, TEMIT’s NAV and share price total returns of 7.9% and 4.9%, respectively, compared with the benchmark’s 5.9% total return. The NAV outperformance was primarily due to positive sector allocation, with the largest positive contributions from overweight IT (+1.5pp), underweight energy (+0.6pp) and overweight communication services (+0.4pp), while the largest detractor was overweight healthcare (-0.4pp). By geography, overweight exposures to Taiwan, South Korea and Brazil added to performance (+2.2pp, +1.8pp and +1.4pp respectively), while the underweight Indian exposure was a negative contributor (-2.4pp).
Looking at individual stocks, in FY24, the largest positive contributors were: TSMC (+1.3pp, a beneficiary of the growth in AI); Petrobras (+1.3pp, announced a new shareholder return policy and benefited from higher crude oil prices); and Samsung (LON:0593xq) Life Insurance (+1.1pp, South Korea’s Value-Up Programme is expected to lead to increased cash returns to shareholders). On the other side of the ledger were: Guangzhou Tinci Materials Technology (-1.2pp, industry oversupply and weak lithium prices) and Alibaba (NYSE:BABA) (-1.0pp, concerns about slow demand, increased competition and an unclear corporate strategy).
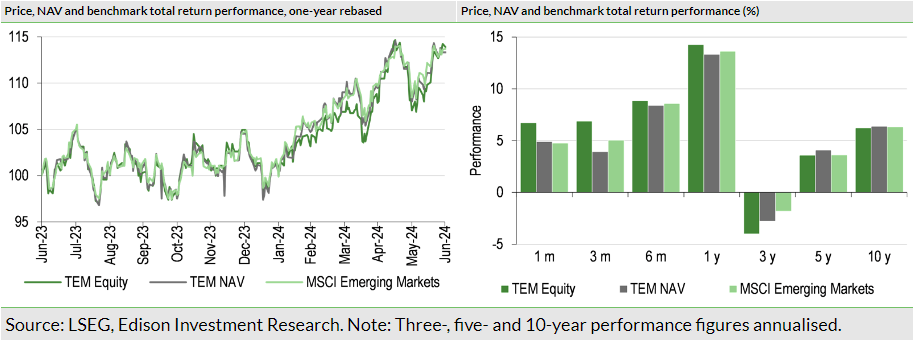
TEMIT’s relative returns are shown in Exhibit 10. The trust’s NAV is ahead of the benchmark over the last five and 10 years, although its share price has not performed as well, which has resulted in a wider discount.
TEMIT’s upside/downside capture
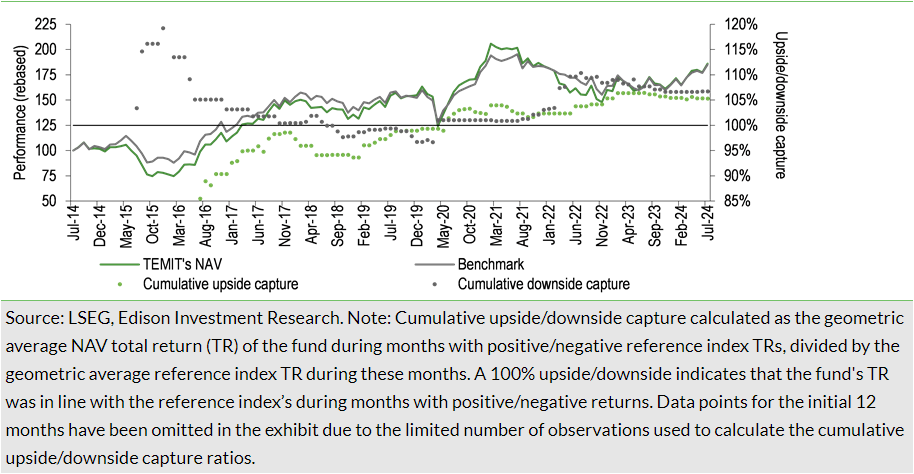
Exhibit 11 shows TEMIT’s upside/downside capture rates over the last 10 years. They are very similar, with an upside capture of 105.3% and a downside capture of 106.7%, suggesting that the fund is likely to modestly outperform its benchmark in months when emerging market share prices rise and underperform to a similar degree during months of emerging market share price weakness.
Dividends: Commitment to steady annual payments
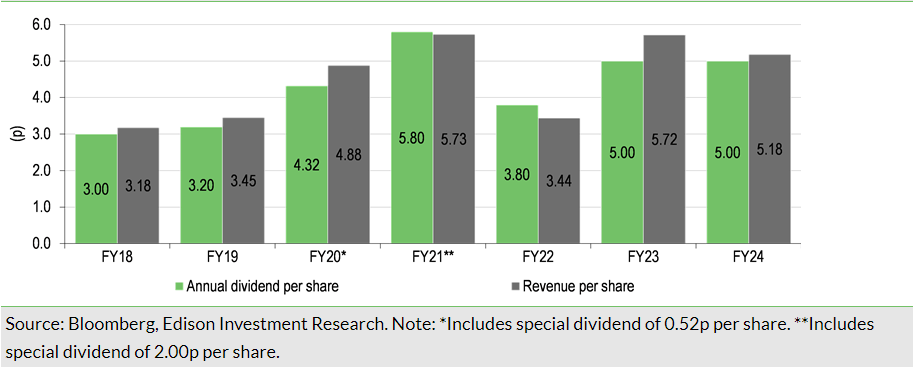
TEMIT pays regular dividends twice a year, an interim in January and a final distribution in July. In respect of FY24, a 2.0p per share interim dividend has been paid and a final 3.0p per share is proposed. The total 5.0p per share (c 1.0x covered) is in line with the FY23 annual dividend and the board intends to at least maintain the 5.0p per share annual dividend for the next five years, using reserves when required. At-end FY24, TEMIT had revenue reserves of c 11.7p per share, which is equivalent to c 2.3x the annual dividend.
Discount: Step-up in share repurchases
TEMIT’s board has announced an enhanced share repurchase programme. Over the last five financial years, 142.3m shares have been bought back at a cost of £218.2m. The pace of share repurchases will be substantially increased, and if the trust’s wide discount persists, £200m will be spent on share buybacks over the next 12–24 months, continuing at a suitable rate thereafter.
A new conditional performance-based tender offer has also been introduced (subject to the five-year continuation vote being passed at the July 2024 AGM). If TEMIT’s total return underperforms its benchmark’s total return in the five years to 31 March 2029, a tender offer will be launched at the board’s discretion, for up to 25% of the trust priced at the prevailing NAV less 2% (to cover costs). The conditions for the last discretionary performance-based tender offer were not met, as in the five years to 31 March 2024, the trust’s NAV total return was 8.3pp higher than the benchmark’s total return.
TEMIT’s current 13.7% share price discount to cum-income NAV is at the wider end of the last three-year range (Exhibit 13) and wider than the 12.7%, 11.8% and 11.9% average discounts over the last three, five and 10 years respectively.
Fund profile: Largest UK emerging markets trust
TEMIT is the UK’s largest emerging markets investment trust and was launched in June 1989. Its shares are quoted on both the London and New Zealand stock exchanges. The trust is managed by Franklin Templeton Emerging Markets Equity (FTEME), a pioneer in emerging markets investing with c $30bn of assets under management.
Chetan Sehgal has been TEMIT’s lead manager since 1 February 2018; he is based in Singapore and has more than 30 years’ investment experience. He was joined in September 2018 by Edinburgh-based Andrew Ness, who has 30 years’ investment experience. The managers aim to generate long-term capital growth by investing in companies listed in emerging markets, or those listed in developed markets that earn a significant amount of their revenues in emerging markets. TEMIT’s performance is measured against the MSCI Emerging Markets Index. There are no specific restrictions on the fund’s geographic or sector exposure but, to mitigate risk, at the time of investment, a maximum 12% of assets may be held in a single issuer, and up to 10% of assets may be invested in unlisted securities (a maximum 2% in a single issuer). Gearing of up to 20% of NAV is permitted. The trust is subject to a five-yearly continuation vote, with the next due at the July 2024 AGM (the July 2019 vote was passed with a 99.95% majority).
Investment process: Bottom-up stock selection
Sehgal and Ness, who are assisted by portfolio analyst Manish Agarwal, are able to draw on the considerable resources of FTEME’s investment team. In recent years, the levels of collaboration and communication within the team have continued to be enhanced; there are regular meetings, both formal and informal, and all analysts and portfolio managers are expected to contribute to investment returns.
The managers employ a long-term approach driven by ‘3S’s’: seeking structural growth opportunities, investing in businesses with sustainable earnings power that are trading at a discount to their estimated intrinsic value, and they believe in responsible stewardship of client capital. TEMIT has a three-step investment process:
- Idea generation: there is a team of more than 70 analysts and portfolio managers around the globe, who undertake more than 2,000 company meetings a year. Sehgal and Ness consider that the team’s local presence provides a considerable competitive advantage.
- Stock research: the team undertakes rigorous analysis to assess whether a company has sustainable earnings power and to determine a proprietary estimate of its intrinsic worth. FTEME’s research platform has coverage of more than 700 companies. In-depth company models are built to evaluate a firm’s financial strength and profitability, and to project future earnings and cash flow. Industry demand and supply models are incorporated into the analysis, along with country and currency macroeconomic considerations.
- Portfolio construction: TEMIT’s strategy aims to deliver outperformance irrespective of the direction of the stock market. The portfolio typically has higher quality and growth metrics than the benchmark, but not at excessive valuations. There is a high-conviction approach, with the top 10 holdings generally making up more than 40% of the fund. Portfolio turnover is relatively low at typically less than 20% per year.
As shown in Exhibit 15, at the end of May 2024, TEMIT had lower valuation multiples compared with the benchmark (trailing P/E, price-to-cash flow and price-to-book). Its dividend yield was a little higher and, in aggregate, the trust’s portfolio companies were less indebted compared with benchmark companies.
Risk management is also a very important part of the process, with scenario analysis undertaken to ensure the managers are not taking unintentional risks. TEMIT has a diversified portfolio of 60–90 positions invested across the market cap spectrum. All holdings are regularly reviewed to ensure analysts’ recommendations are up to date and reflect any changes in a company’s fundamentals. Sehgal and Ness believe that given the wide dispersion of returns between shares in emerging markets, they can generate alpha via stock selection, which is deemed more important than sector and geographic allocation. The trust’s active share typically ranges from 70% to 85% (this is a measure of how a fund differs from its benchmark, with 0% representing full index replication and 100% indicating no commonality).
TEMIT’s approach to ESG
ESG factors are an integral part of TEMIT’s research process. Its managers employ FTEME’s three-pillar framework, aiming to be an emerging market leader in sustainable investing:
- Intentionality: assessing companies’ intentionality towards managing material ESG factors with a proprietary scoring system and linking them into valuation models.
- Alignment: mapping the alignment of companies’ products and services to positive and environmental outcomes and United Nations Sustainable Development Goals.
- Transition: identifying companies’ transition potential linked to their incremental progress, using FTEME’s on-the-ground capabilities and experience as an active owner to foster positive change.
Where material, climate change/carbon analysis is integrated into the bottom-up research process, focusing on assessing the impact on long-term business values. This is part of the holistic approach of integrating ESG analysis with traditional analysis to gain valuable insights into the quality and risks of investee and potential investee companies. For more information, please see TEMIT’s latest stewardship report.
Gearing
Historically, TEMIT had a 2.089% five-year fixed rate loan of £100m maturing on 31 January 2025 and a £120m revolving credit facility (RCF). When the RCF matured in January 2024, the board decided not to renew it as the facility was unused and interest rates are now higher than when the loan was taken out.
The board and the trust’s managers are exploring alternative forms of gearing such as contracts for difference and other derivatives; an announcement will be made in due course.
Fees and charges
TEMIT’s current management fee is 1.00% of net assets up to £1bn, 0.75% between £1bn and £2bn and 0.50% above £2bn; no performance fee is payable. In FY24, the trust’s ongoing charges were 0.97%, which was 1bp lower than 0.98% in FY23.
The board has negotiated a phased reduction in fees between now and mid-2026. With effect from 1 July 2024 and 1 July 2025, the fee for net assets between £1bn and £2bn will reduce to 0.70% and 0.60%, respectively. Then with effect from 1 July 2026, the fee will be 1.00% of net assets up to £1bn and 0.50% above £1bn. Based on the trust’s current c £2bn net asset value, the blended fee will reduce from c 0.875% to 0.75% in 2026.
Capital structure
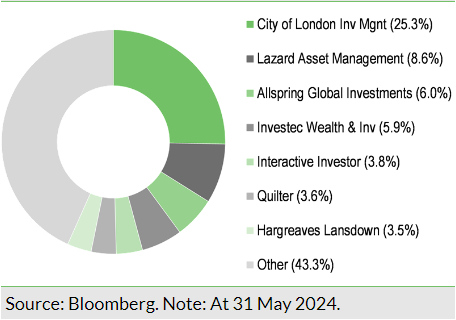
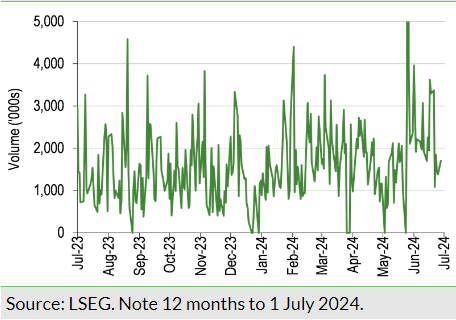
TEMIT is a conventional investment trust with one class of share; there are c 1.1bn ordinary shares in issue with a further c 103.8m shares held in treasury. Its average daily trading volume over the last 12 months was c 1.8m shares.
The board
TEMIT’s newest independent, non-executive director is Chairman Angus Macpherson. He is CEO of independent boutique Scottish corporate finance business Noble & Company (UK), and a non-executive director of Hampton & Co and Schroder Japan Growth Fund. Macpherson was based in Singapore and Hong Kong between 1995 and 2004 and was previously chairman of Pacific Horizon Investment Trust and Henderson Diversified Income Trust.
Shareholders will vote at the July 2024 AGM on the proposed increase in the directors’ annual fees in respect of FY25: chairman +£1,500 to £74,500; chairman of the audit and risk committee and senior independent director +£3,000 to £61,500; and independent directors +£1,000 to £42,000.
________________________________
General disclaimer and copyright
This report has been commissioned by Templeton Emerging Markets Investment Trust and prepared and issued by Edison, in consideration of a fee payable by Templeton Emerging Markets Investment Trust. Edison Investment Research standard fees are £60,000 pa for the production and broad dissemination of a detailed note (Outlook) following by regular (typically quarterly) update notes. Fees are paid upfront in cash without recourse. Edison may seek additional fees for the provision of roadshows and related IR services for the client but does not get remunerated for any investment banking services. We never take payment in stock, options or warrants for any of our services.
Accuracy of content: All information used in the publication of this report has been compiled from publicly available sources that are believed to be reliable, however we do not guarantee the accuracy or completeness of this report and have not sought for this information to be independently verified. Opinions contained in this report represent those of the research department of Edison at the time of publication. Forward-looking information or statements in this report contain information that is based on assumptions, forecasts of future results, estimates of amounts not yet determinable, and therefore involve known and unknown risks, uncertainties and other factors which may cause the actual results, performance or achievements of their subject matter to be materially different from current expectations.
Exclusion of Liability: To the fullest extent allowed by law, Edison shall not be liable for any direct, indirect or consequential losses, loss of profits, damages, costs or expenses incurred or suffered by you arising out or in connection with the access to, use of or reliance on any information contained on this note.
No personalised advice: The information that we provide should not be construed in any manner whatsoever as, personalised advice. Also, the information provided by us should not be construed by any subscriber or prospective subscriber as Edison’s solicitation to effect, or attempt to effect, any transaction in a security. The securities described in the report may not be eligible for sale in all jurisdictions or to certain categories of investors.
Investment in securities mentioned: Edison has a restrictive policy relating to personal dealing and conflicts of interest. Edison Group does not conduct any investment business and, accordingly, does not itself hold any positions in the securities mentioned in this report. However, the respective directors, officers, employees and contractors of Edison may have a position in any or related securities mentioned in this report, subject to Edison's policies on personal dealing and conflicts of interest.
Copyright: Copyright 2024 Edison Investment Research Limited (Edison).
Australia
Edison Investment Research Pty Ltd (Edison AU) is the Australian subsidiary of Edison. Edison AU is a Corporate Authorised Representative (1252501) of Crown Wealth Group Pty Ltd who holds an Australian Financial Services Licence (Number: 494274). This research is issued in Australia by Edison AU and any access to it, is intended only for "wholesale clients" within the meaning of the Corporations Act 2001 of Australia. Any advice given by Edison AU is general advice only and does not take into account your personal circumstances, needs or objectives. You should, before acting on this advice, consider the appropriateness of the advice, having regard to your objectives, financial situation and needs. If our advice relates to the acquisition, or possible acquisition, of a particular financial product you should read any relevant Product Disclosure Statement or like instrument.
New Zealand
The research in this document is intended for New Zealand resident professional financial advisers or brokers (for use in their roles as financial advisers or brokers) and habitual investors who are “wholesale clients” for the purpose of the Financial Advisers Act 2008 (FAA) (as described in sections 5(c) (1)(a), (b) and (c) of the FAA). This is not a solicitation or inducement to buy, sell, subscribe, or underwrite any securities mentioned or in the topic of this document. For the purpose of the FAA, the content of this report is of a general nature, is intended as a source of general information only and is not intended to constitute a recommendation or opinion in relation to acquiring or disposing (including refraining from acquiring or disposing) of securities. The distribution of this document is not a “personalised service” and, to the extent that it contains any financial advice, is intended only as a “class service” provided by Edison within the meaning of the FAA (i.e. without taking into account the particular financial situation or goals of any person). As such, it should not be relied upon in making an investment decision.
United Kingdom
This document is prepared and provided by Edison for information purposes only and should not be construed as an offer or solicitation for investment in any securities mentioned or in the topic of this document. A marketing communication under FCA Rules, this document has not been prepared in accordance with the legal requirements designed to promote the independence of investment research and is not subject to any prohibition on dealing ahead of the dissemination of investment research.
This Communication is being distributed in the United Kingdom and is directed only at (i) persons having professional experience in matters relating to investments, i.e. investment professionals within the meaning of Article 19(5) of the Financial Services and Markets Act 2000 (Financial Promotion) Order 2005, as amended (the "FPO") (ii) high net-worth companies, unincorporated associations or other bodies within the meaning of Article 49 of the FPO and (iii) persons to whom it is otherwise lawful to distribute it. The investment or investment activity to which this document relates is available only to such persons. It is not intended that this document be distributed or passed on, directly or indirectly, to any other class of persons and in any event and under no circumstances should persons of any other description rely on or act upon the contents of this document.
This Communication is being supplied to you solely for your information and may not be reproduced by, further distributed to or published in whole or in part by, any other person.
United States
Edison relies upon the "publishers' exclusion" from the definition of investment adviser under Section 202(a)(11) of the Investment Advisers Act of 1940 and corresponding state securities laws. This report is a bona fide publication of general and regular circulation offering impersonal investment-related advice, not tailored to a specific investment portfolio or the needs of current and/or prospective subscribers. As such, Edison does not offer or provide personal advice and the research provided is for informational purposes only. No mention of a particular security in this report constitutes a recommendation to buy, sell or hold that or any security, or that any particular security, portfolio of securities, transaction or investment strategy is suitable for any specific person.
London │ New York │ Frankfurt
20 Red Lion Street
London, WC1R 4PS
United Kingdom
Related Articles

Using the Elliott Wave Principle (EWP), we have been tracking the most likely path forward for the Nasdaq 100 (NDX). Although there are many ways to navigate the markets and to...

Investors are on edge about what tariff policy means for markets Coming off a strong Q4 earnings season, fresh February corporate sales figures can help assess the macro...

Broadcom stock is in a dynamic rebound phase. Markets seem optimistic ahead of the earnings release. Let's take a deep dive into what to expect from the report. Get the...
Are you sure you want to block %USER_NAME%?
By doing so, you and %USER_NAME% will not be able to see any of each other's Investing.com's posts.
%USER_NAME% was successfully added to your Block List
Since you’ve just unblocked this person, you must wait 48 hours before renewing the block.
I feel that this comment is:
Thank You!
Your report has been sent to our moderators for review









Add a Comment
We encourage you to use comments to engage with users, share your perspective and ask questions of authors and each other. However, in order to maintain the high level of discourse we’ve all come to value and expect, please keep the following criteria in mind:
Perpetrators of spam or abuse will be deleted from the site and prohibited from future registration at Investing.com’s discretion.