
US stocks fell again yesterday
During the last market session, on Wednesday, the 2 major indices registered losses.
The S&P 500 closed at -0.19% and the Nasdaq was down 0.51%.
Yesterday was the fifth day in a row of the stock market decline.
This negative trend is driven by investors' concern about the Federal Reserve monetary policy that could be more aggressive and could last for a longer period than expected.
That is because the recent economic data are still showing growth.
Strong economic data have also caused the inversion of the US yield curve, which is currently at a level that has not been reached since 1981.
Clearly, investors are expecting a recession as soon as next year.
Data to be released today
Financial markets can be volatile today following the release of the report about the US initial jobless claims for the week ending on December 3rd at 1:30 PM GMT.
S&P 500 Technical Analysis - Daily Chart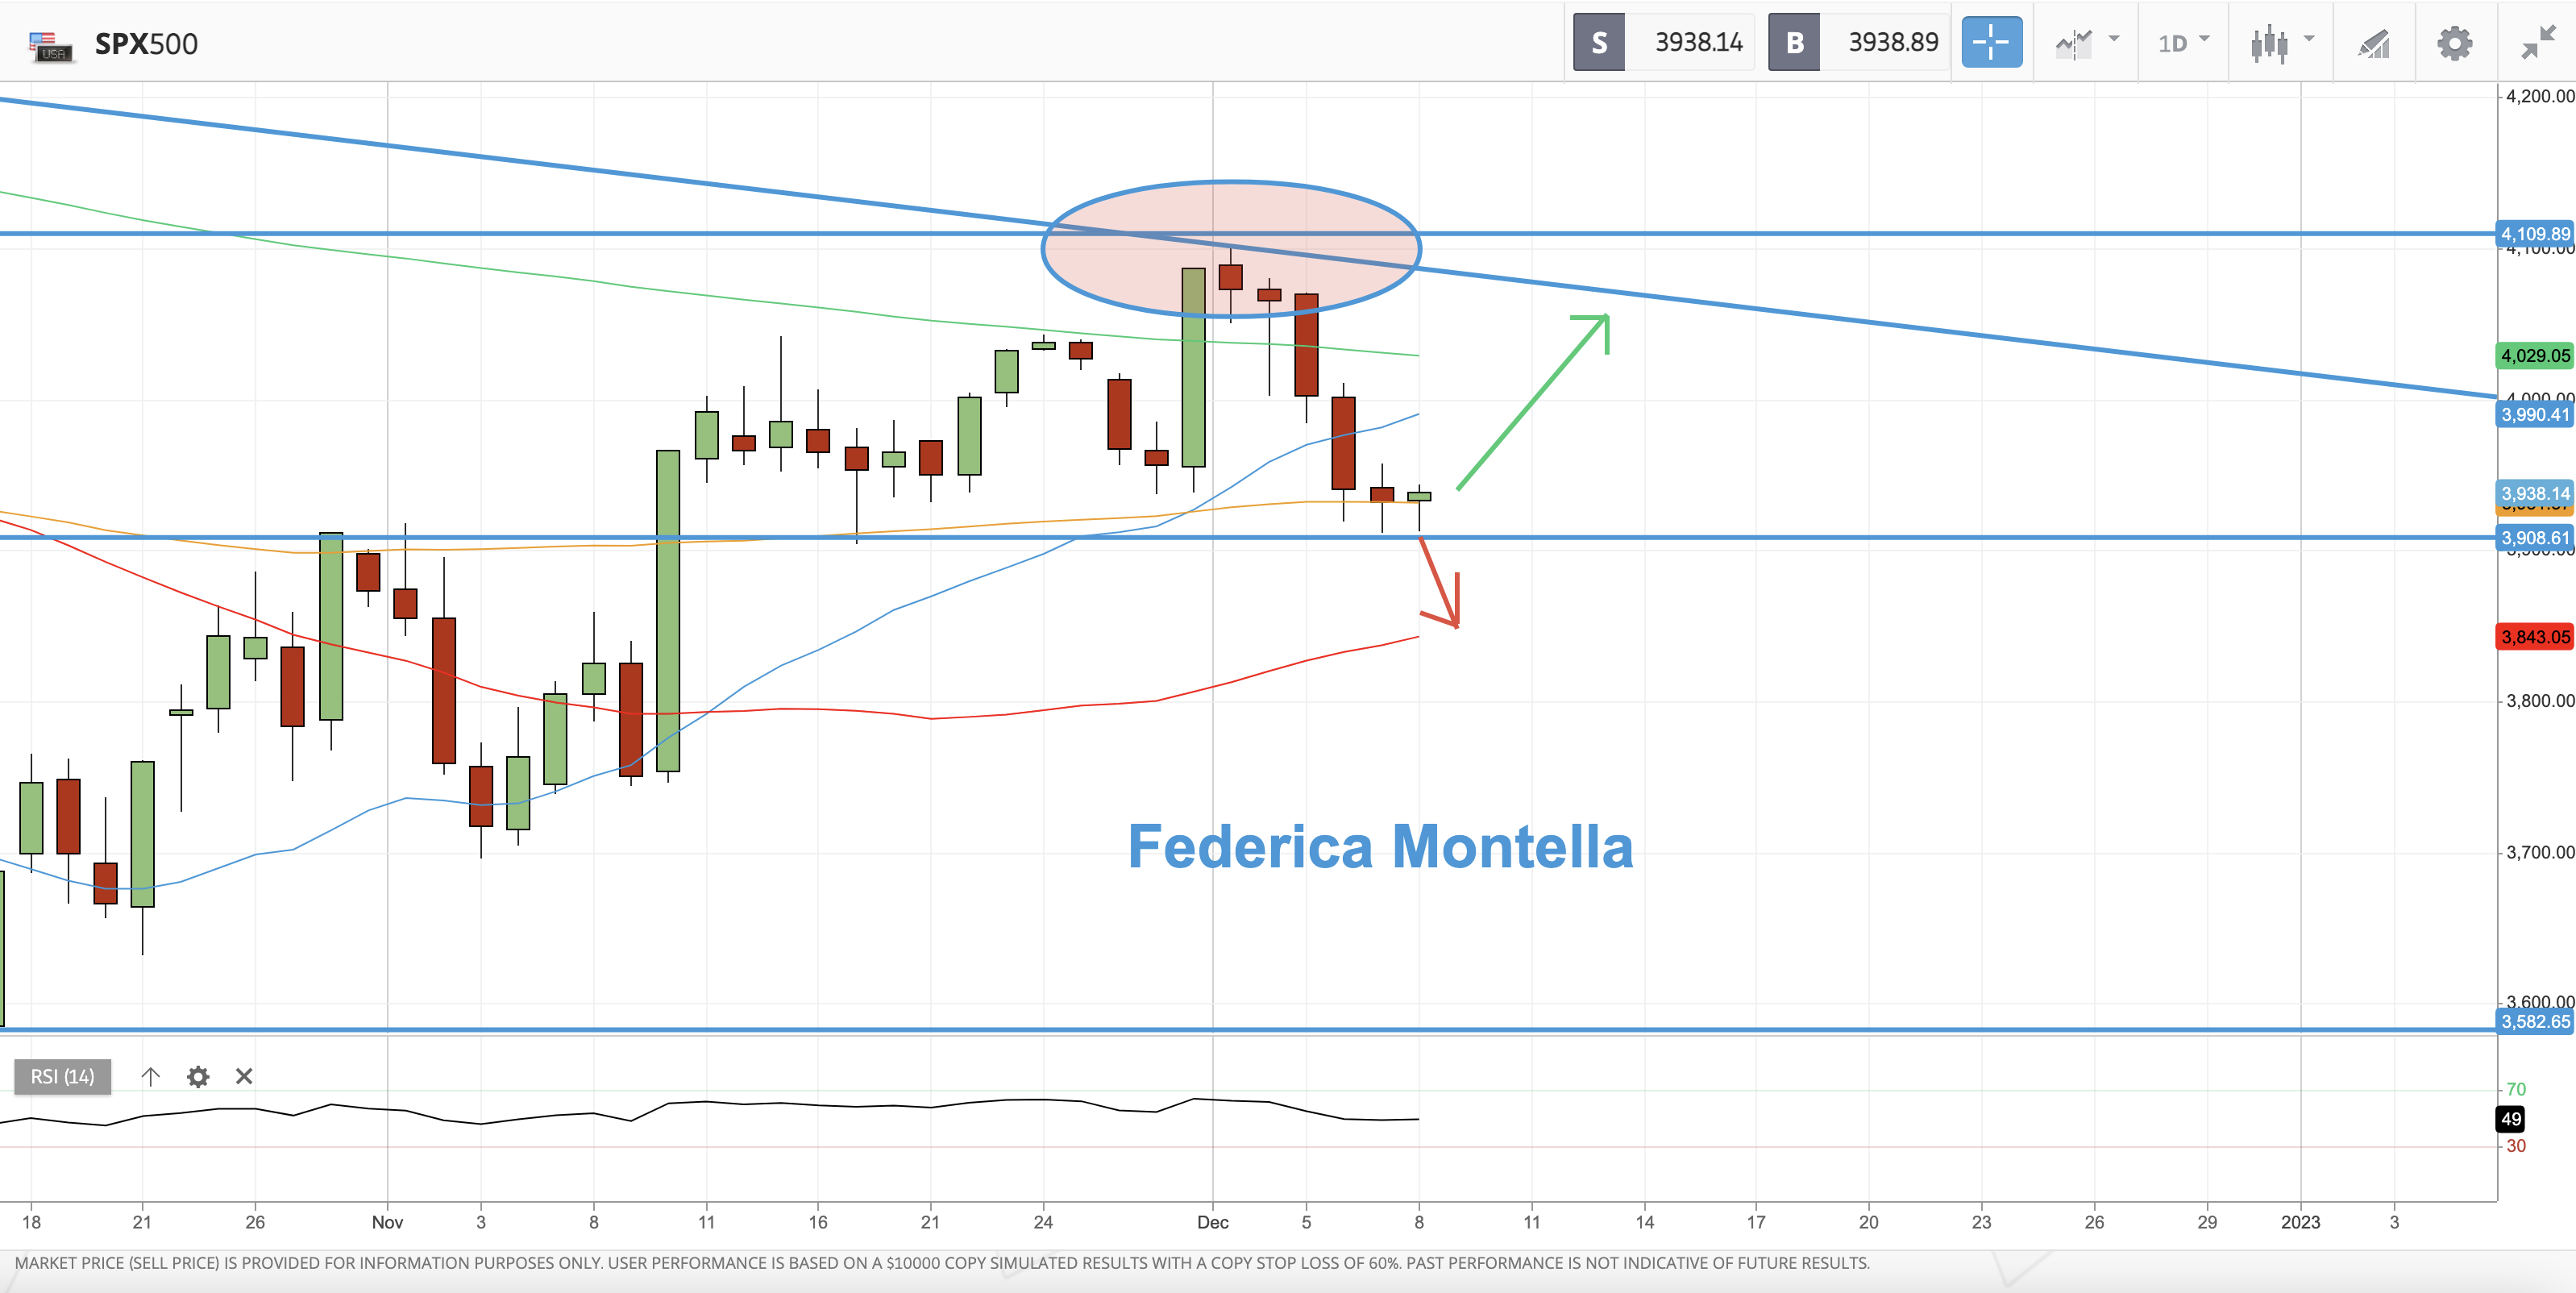
The S&P 500 price hasn't moved much yesterday.
The index price closed above the horizontal support line at around 3900 and above the 100-day MA (orange moving average).
This is a positive sign.
If the price is able to consolidate and hold this support, we could see the price increase and retest again the bear market trendline, otherwise, prices could drop to the next support level at the 50-day MA (red moving average) at around 3843.
The only option to change the current scenario to a new bullish trend would be for the price to move back above the 4100 resistance level.
The RSI stands at 49, indicating a neutral/bearish trend.
US Dollar Index Technical Analysis - Daily Chart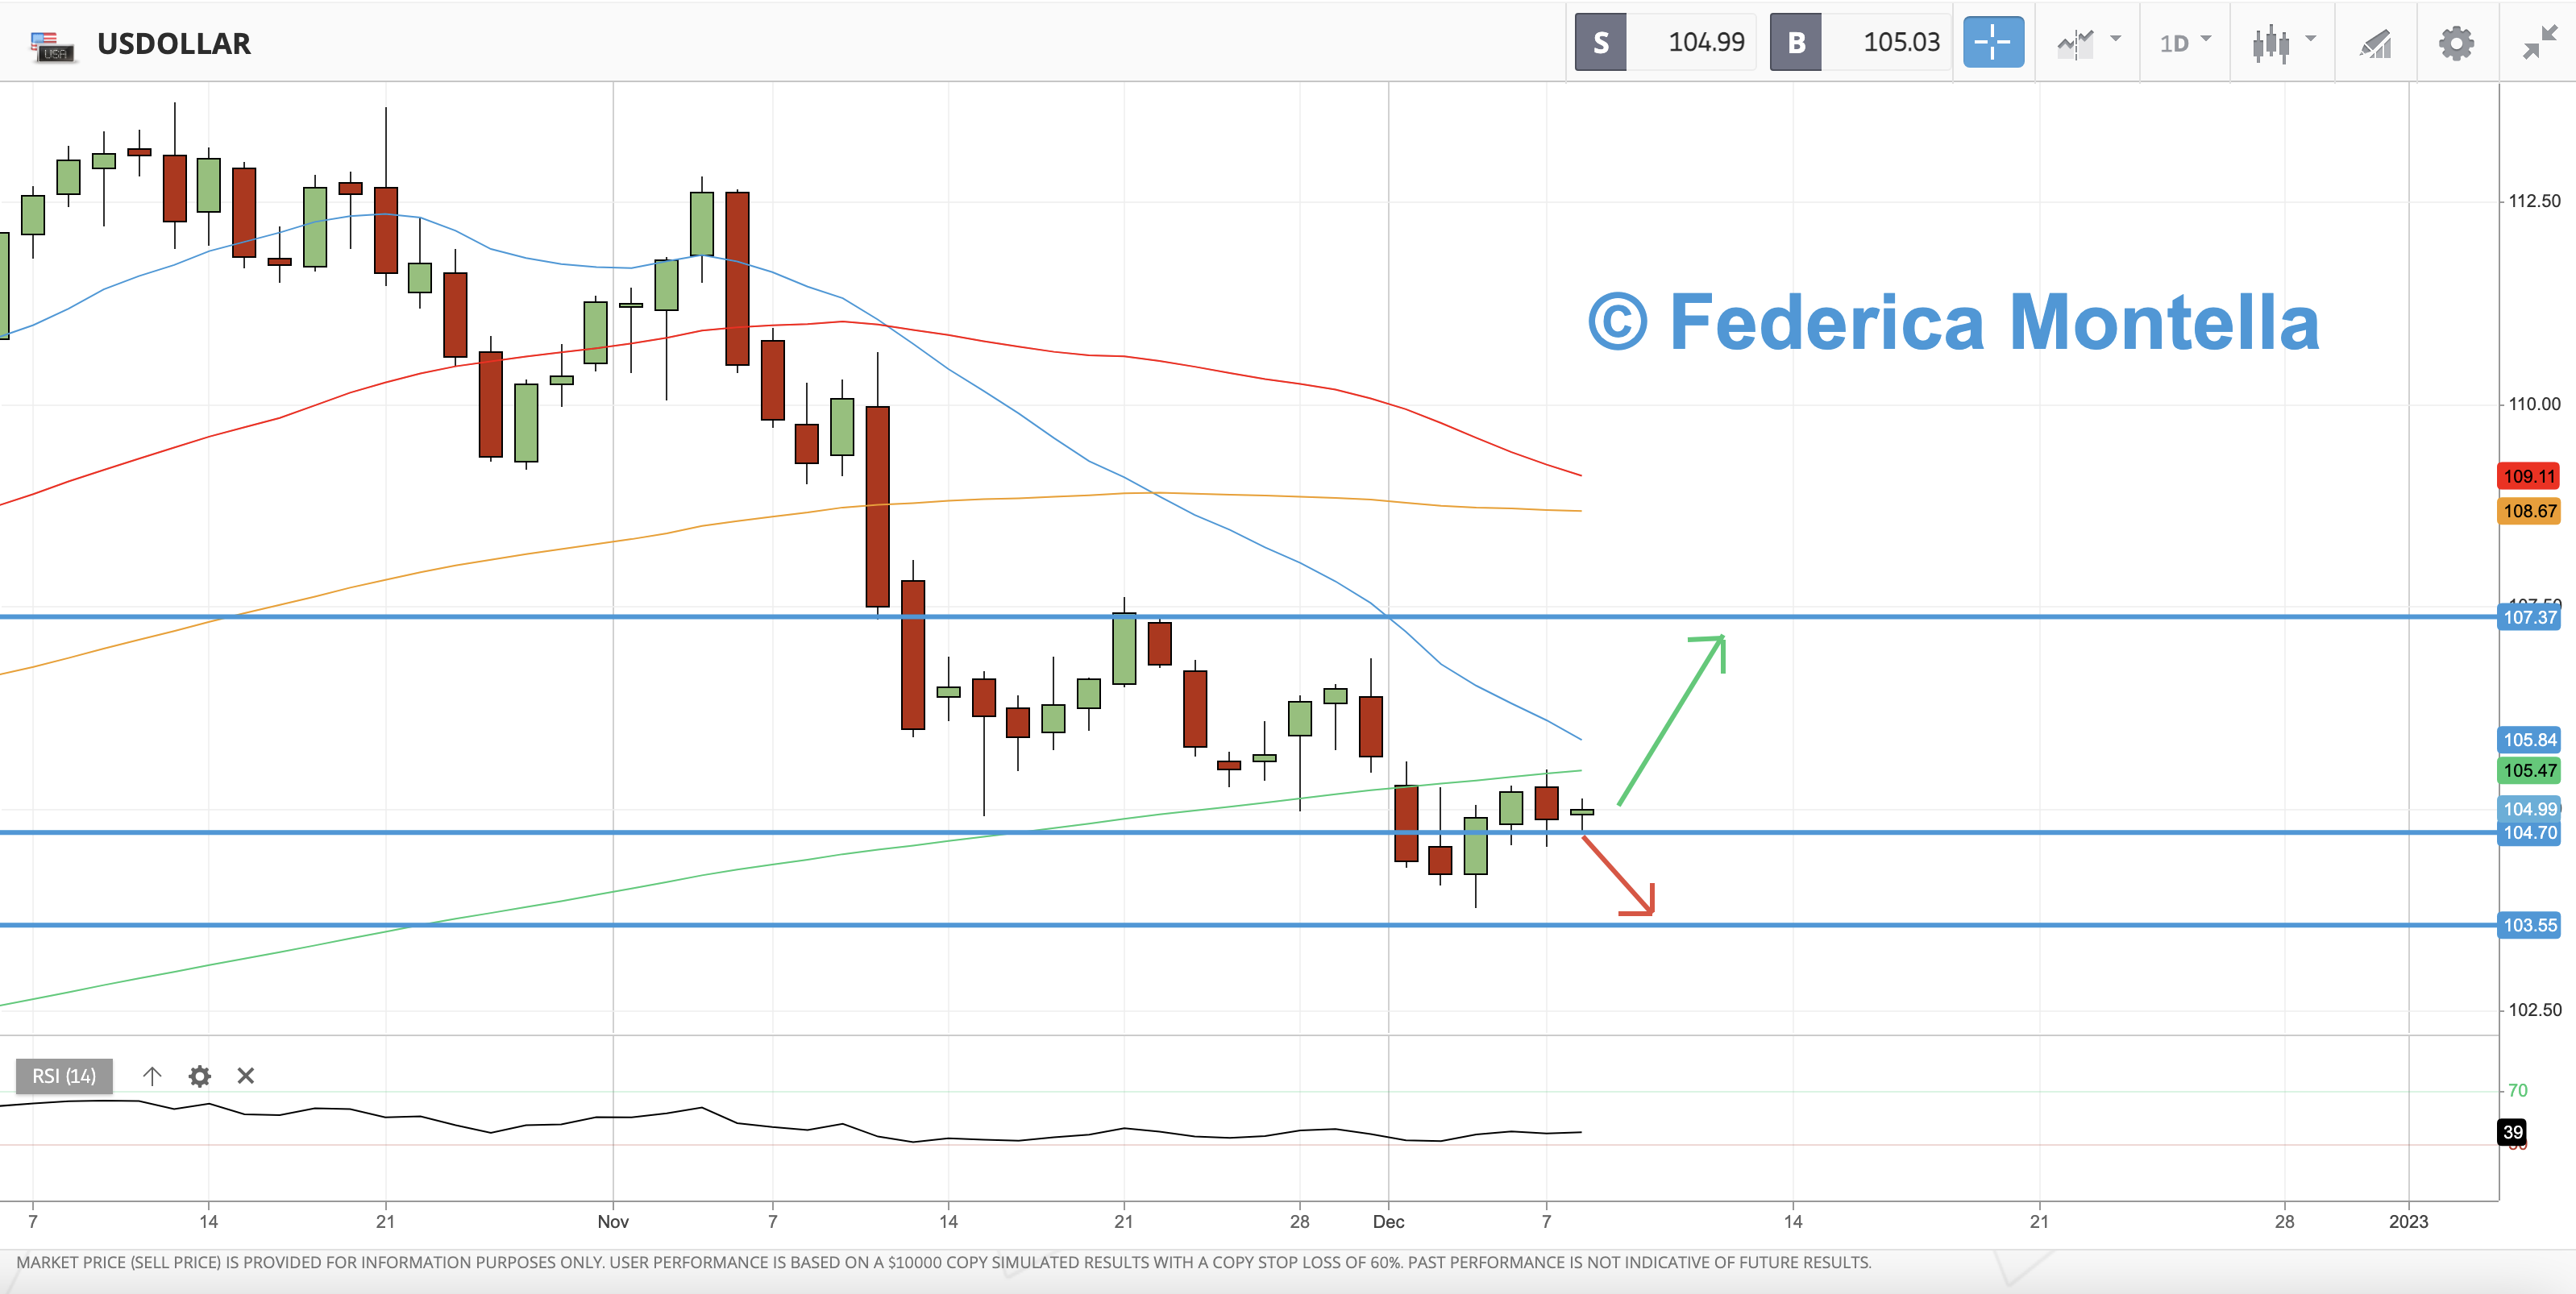
The U.S. Dollar Index has been rejected yesterday at its key support level, the 200-day MA (green moving average).
This is a bearish signal for the dollar, but it's a bullish signal for stocks because the US Dollar and the S&P 500 move in opposite directions.
If the Dollar Index will remain below the 200-day MA, it could support a rally in the S&P 500 Index for some time.
However, both the S&P 500 and the Dollar Index are currently trading below their key level, which is unusual, so the next direction of the dollar will be a leading indicator for US stocks.
The next few days' price action will dictate the market direction.
US Dollar Index Technical Analysis - Weekly Chart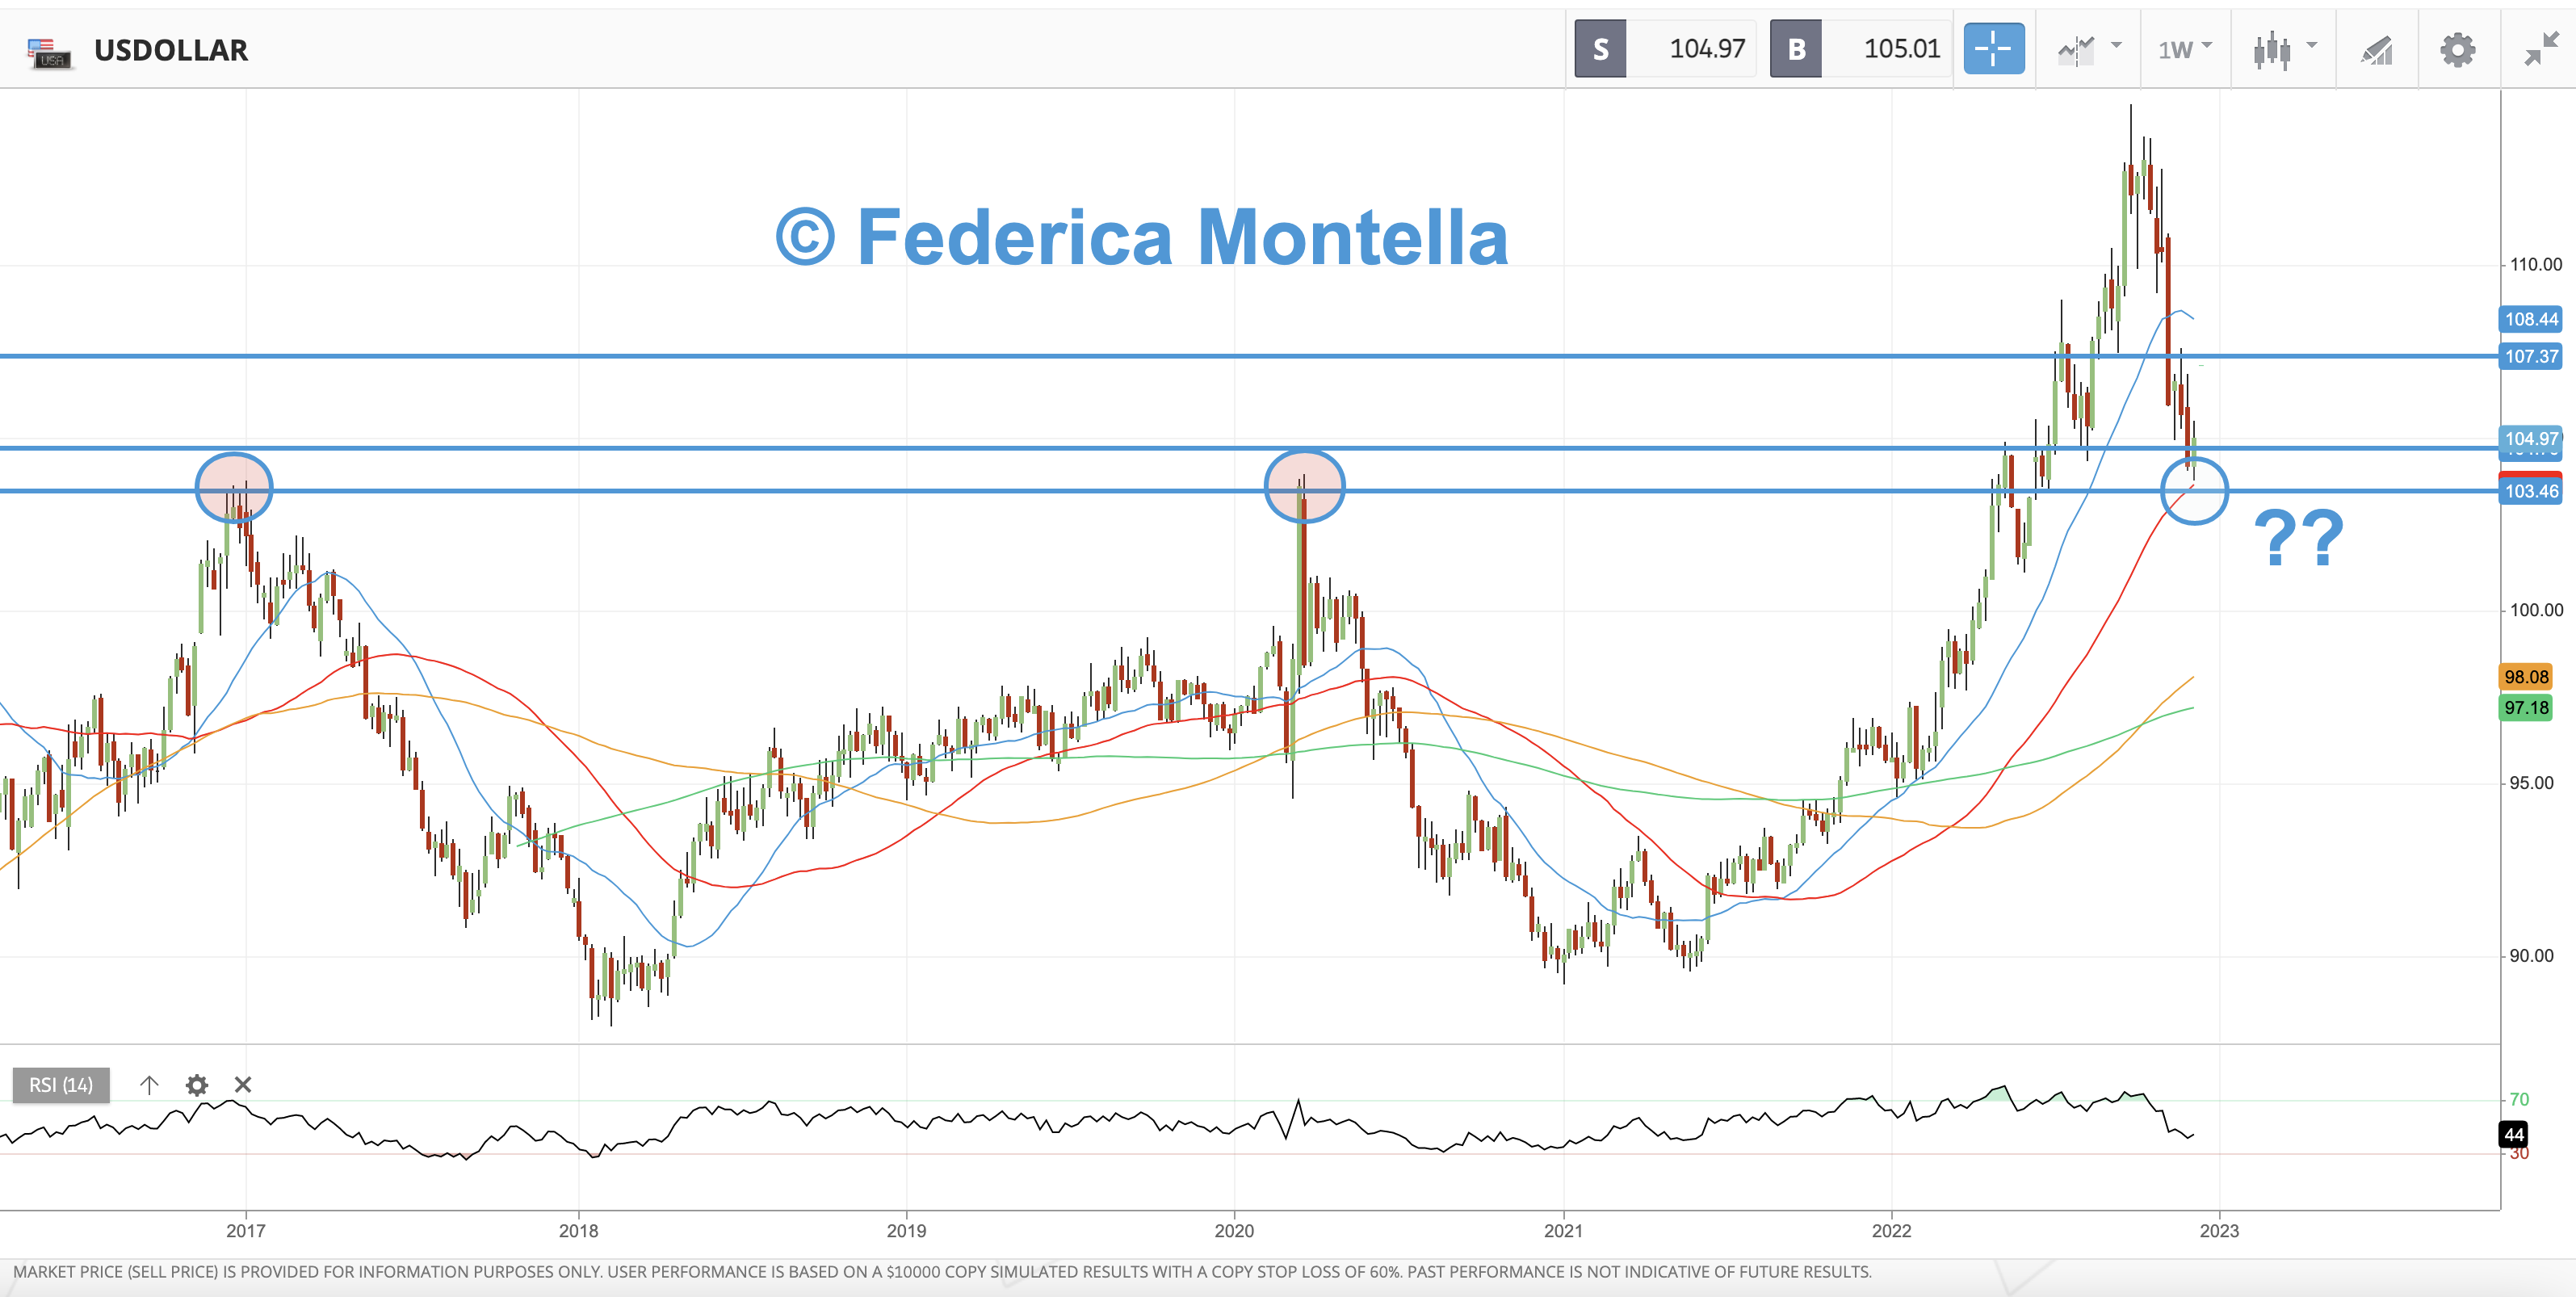
On the weekly timeframe, we can notice that the 103.46 level is very important for the US dollar index since it has worked as a strong resistance in 2017 ad 2020, but it could work as support right now.
This level is also in line with the 50-weekly MA (red moving average).
Investors will need to monitor the retest or the breakout of this important level.
If the Dollar Index were to fall below this level, we could see a rally heading into the year-end (Santa Rally).
If the index will be able to hold this support and jump higher, we will see further downside in stock prices.
Sentiment Indicator - Fear & Greed Index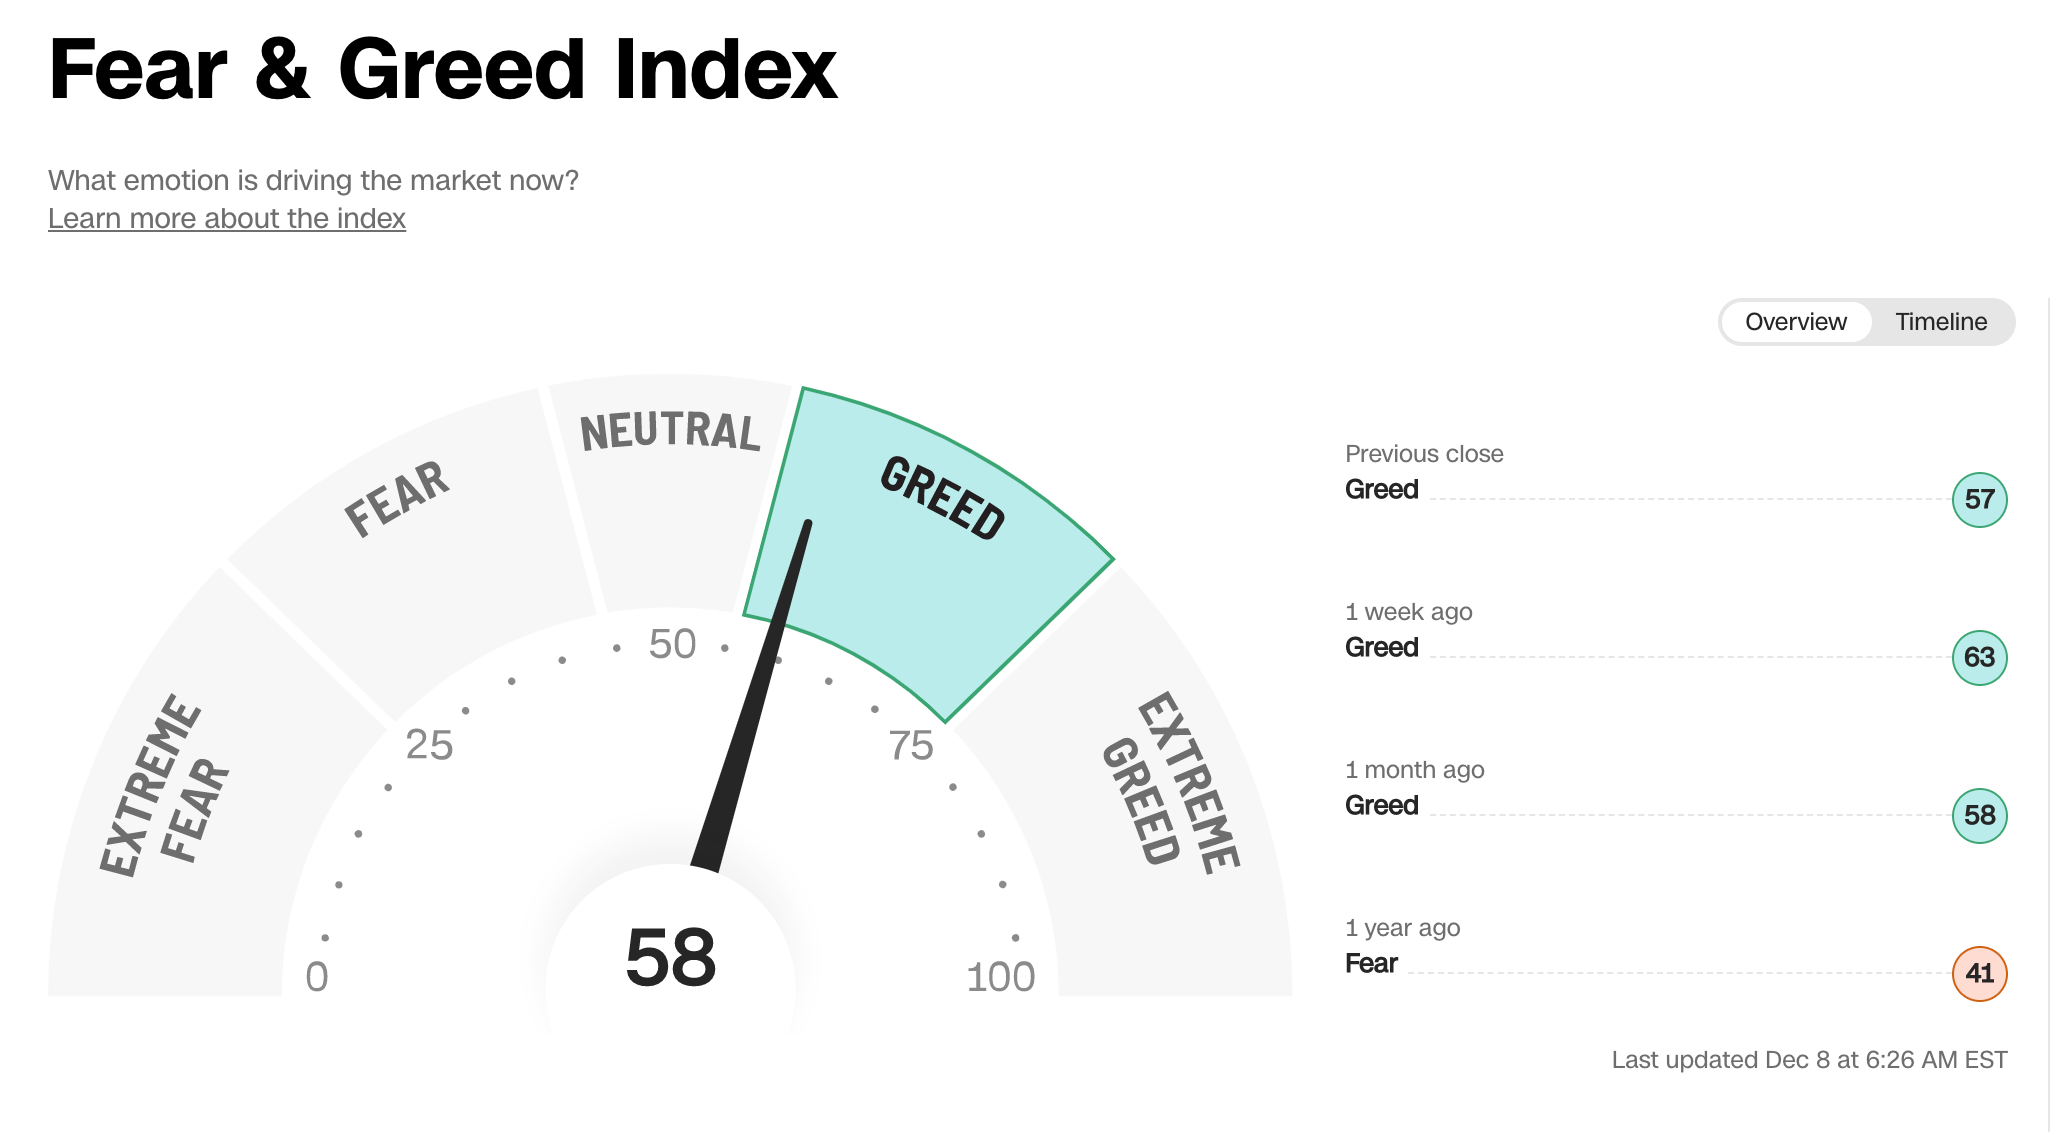
The market sentiment is at 58 in the "Greed" mode which is lower than the level registered one week ago.
The fear of a recession will likely push both the investor's sentiment and stock prices down.
FedWatch Tool - FED rates probabilities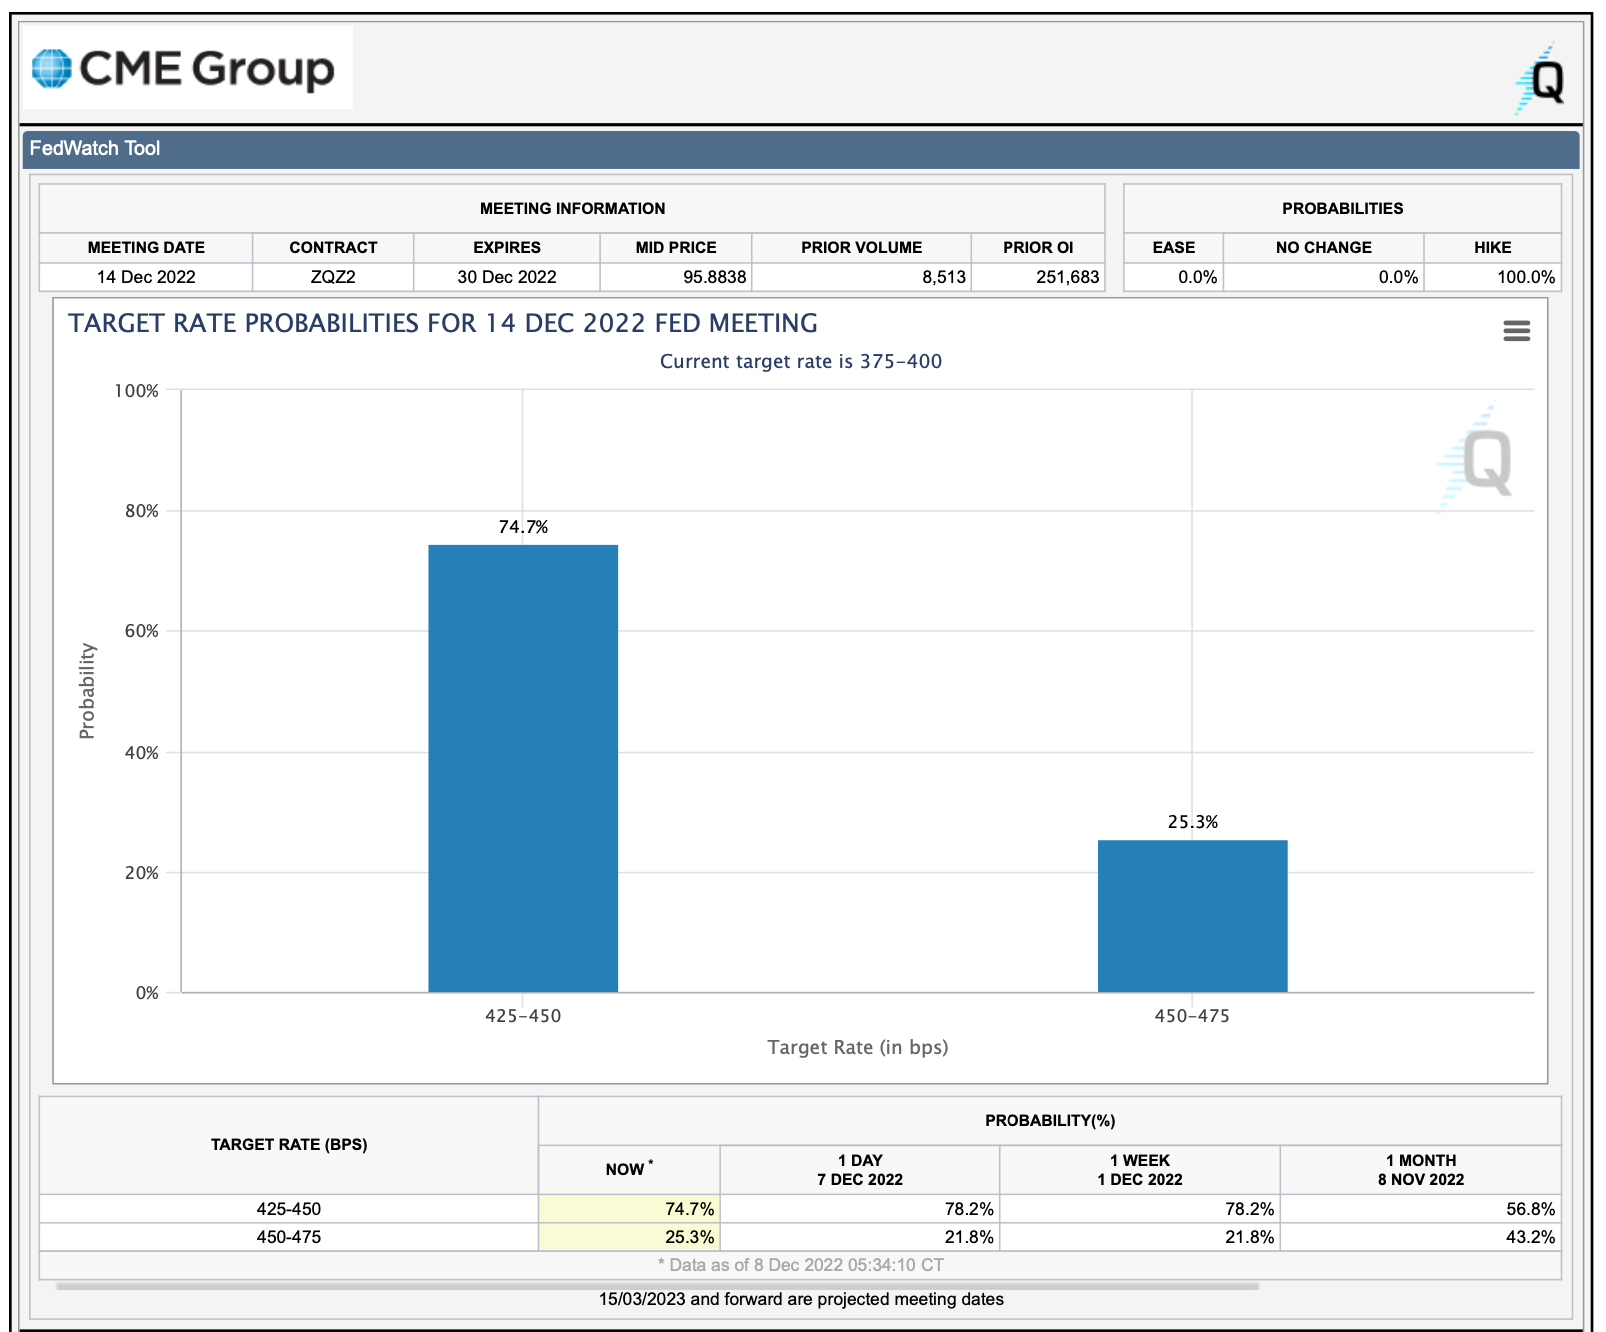
74.7% of investors are expecting the FED to increase the interest rates by 0.50% in the next meeting.
The remaining 25.3% are expecting a 0.75% rate increase.
The data show us that the number of investors expecting an increase of 0.75% is getting higher than in the previous days.
The next FED meeting is approaching next week, on 14 December 2022.
- English (USA)
- English (India)
- English (Canada)
- English (Australia)
- English (South Africa)
- English (Philippines)
- English (Nigeria)
- Deutsch
- Español (España)
- Español (México)
- Français
- Italiano
- Nederlands
- Polski
- Português (Portugal)
- Português (Brasil)
- Русский
- Türkçe
- العربية
- Ελληνικά
- Svenska
- Suomi
- עברית
- 日本語
- 한국어
- 简体中文
- 繁體中文
- Bahasa Indonesia
- Bahasa Melayu
- ไทย
- Tiếng Việt
- हिंदी
Recession is around the corner, according to the inverted US yield curve
Published 08/12/2022, 12:54
Updated 28/07/2023, 11:55
Recession is around the corner, according to the inverted US yield curve
3rd party Ad. Not an offer or recommendation by Investing.com. See disclosure here or
remove ads
.
Latest comments
Not the US will have a recession in 2023. Inflation is on the decline, and the prices of all energy, raw materials and labor are also falling. Moreover, the Chinese economy will soon be launched and the economic growth that has been waiting for 2 years will begin in the world.
Hi … thank you for your technical thoughts … about the US recession, it’s one most well-advertised event in the financial media (will investors yawn when tge Godot-recession does come ?) … In the meantime, it’s great to see the SPX holding 3910 and bouncing ! … Will Santa tell the Grinch to stay in his corner? … Hope so ! Marry Christmas to all !
4
hi
Thank you for your timely succinct analysis.
You are welcome. I hope it helps
Install Our App
Risk Disclosure: Trading in financial instruments and/or cryptocurrencies involves high risks including the risk of losing some, or all, of your investment amount, and may not be suitable for all investors. Prices of cryptocurrencies are extremely volatile and may be affected by external factors such as financial, regulatory or political events. Trading on margin increases the financial risks.
Before deciding to trade in financial instrument or cryptocurrencies you should be fully informed of the risks and costs associated with trading the financial markets, carefully consider your investment objectives, level of experience, and risk appetite, and seek professional advice where needed.
Fusion Media would like to remind you that the data contained in this website is not necessarily real-time nor accurate. The data and prices on the website are not necessarily provided by any market or exchange, but may be provided by market makers, and so prices may not be accurate and may differ from the actual price at any given market, meaning prices are indicative and not appropriate for trading purposes. Fusion Media and any provider of the data contained in this website will not accept liability for any loss or damage as a result of your trading, or your reliance on the information contained within this website.
It is prohibited to use, store, reproduce, display, modify, transmit or distribute the data contained in this website without the explicit prior written permission of Fusion Media and/or the data provider. All intellectual property rights are reserved by the providers and/or the exchange providing the data contained in this website.
Fusion Media may be compensated by the advertisers that appear on the website, based on your interaction with the advertisements or advertisers.
© 2007-2024 - Fusion Media Limited. All Rights Reserved.