
- All Instrument Types
- Indices
- Equities
- ETFs
- Funds
- Commodities
- Currencies
- Crypto
- Bonds
- Certificates
Please try another search

Phase One Set To Be Signed But Is It 'Buy On Rumour, Sell On Fact?'

Market Overview
After months of discussion, today is set to be the day where “phase one” of a US/China trade agreement is signed. Effectively this draws a line under any further escalation in the trade dispute between the world’s two superpower economies. However, US Treasury Secretary Steve Mnuchin notes that existing tariffs will remain in force at least until the signing of a second phase of the agreement. There is much for both sides to work on.
There is a fear therefore that markets have priced in all the good news on this part of the deal and that in the coming days there is a “buy on rumour, sell on fact” reaction as the champagne loses its fizz. What is interesting is that whilst equity markets continue on their liquidity-driven (from the Fed’s repo splurge) rally, Treasury yields have not met the move with similar gusto. This may weigh on the dollar in the coming days. Despite this supposed risk rally of phase one, the US 10 year yield is back around 1.80% this morning and a one week low. This morning we see a slight risk negative and dollar negative move through major markets. This is allowing a yen and gold rebound, whilst equities are slipping. Can it be that “buy on rumour, sell on fact” is already setting in?
Wall Street closed slightly lower with the S&P 500 -0.2% at 3283 with the US futures -0.1%. Asian markets have met this with a mildly negative session too (Nikkei -0.5%, Shanghai Composite -0.5%). European indices are also mildly lower in early moves today with the FTSE futures and DAX futures both -0.1%.
In forex, there is little real direction of conviction, but there is a slight rebound on GBP again, whilst JPY is also being supported. In commodities, gold and silver are ticking higher, whilst oil is slightly weaker.
The first key event on the economic calendar today is UK inflation at 09:30 GMT. UK CPI for December is expected to see little change, with headline CPI remaining at +1.5% (+1.5% in November) and core CPI remaining at +1.7% (+1.7% in November). Eurozone Industrial Production is expected to grow by +0.3% in the month of November which would see the year on year decline improve to -1.1% (from -2.2% in October).
US headline PPI at 13:30 GMT is expected to improve marginally to +1.3% (from +1.1% in November) with core PPI remaining at +1.3% (+1.3% in October). The New York Fed’s Empire State Manufacturing is at 1330GMT and is expected to improve marginally to +4.1 in January (from +3.5 in December). The EIA’s Crude Oil Inventories are expected to return to drawdown with -0.8m barrels (after a build of +1.1m barrels last week). Also, keep an eye out for the Fed’s Beige Book at 1900GMT to highlight the economic outlook.
More Fed speakers today with Patrick Harker (voter, mild hawk) at 1600GMT, and Robert Kaplan (voter, centrist) at 17:00 GMT.
Chart of the Day – EUR/CHF
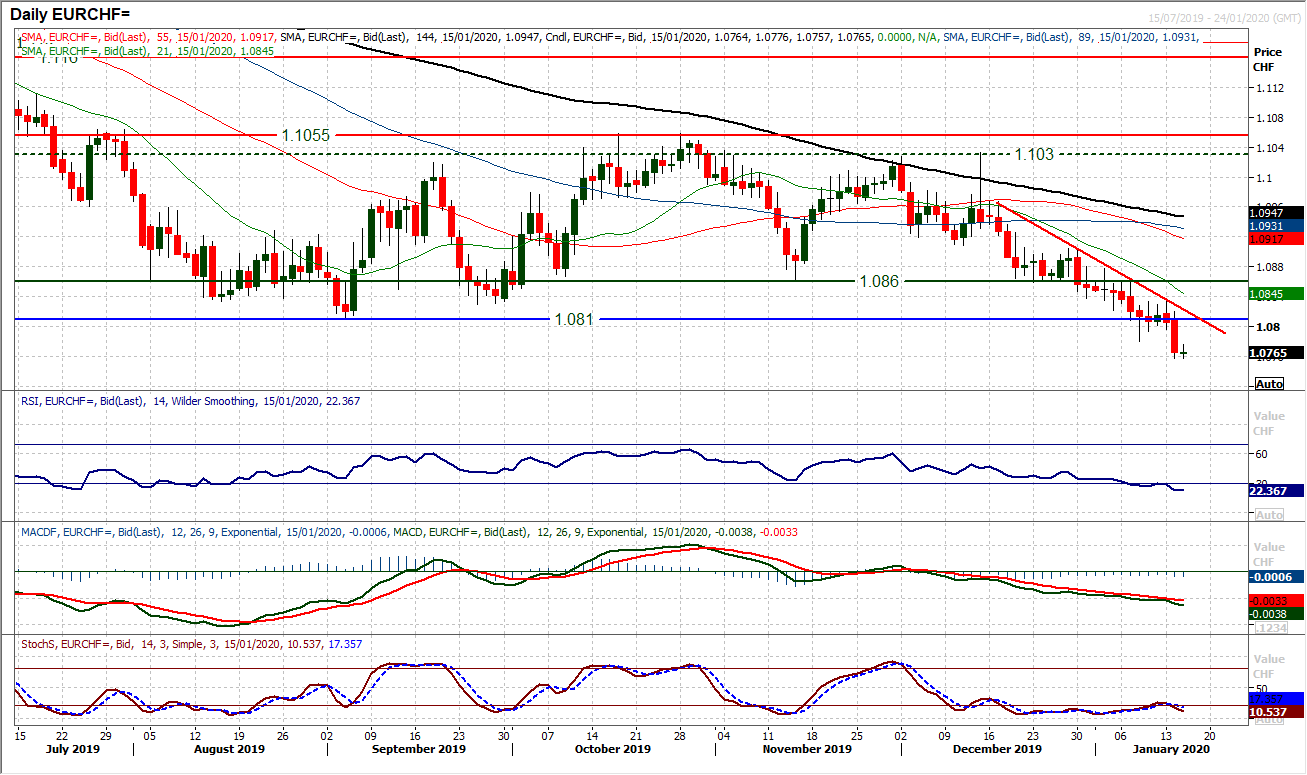
We continue to believe that the euro is set up to perform better in 2020, however crossed against the “currency manipulator” that is the Swiss franc, the single currency remains under pressure and has now seen a key breakdown. Throughout the latter months of 2019, EUR/CHF was holding up well above a key support at 1.0810 but in recent weeks a trend lower has pressured this support. Having been creaking in the past few days, yesterday’s decisive negative candle yesterday has now significantly breached the support. This has taken EUR/CHF to its lowest level since April 2017. A clutch of negatively configured momentum indicators have met the downside break, however, is it a move to chase? The RSI is at its lowest since August 2018 and looks stretched. With the market picking up this morning, a technical rally could well set in near term. However, there is a key band of overhead supply now between 1.0810/1.0860 whilst the resistance of a four week downtrend comes in at 1.0825 today. Look to use a failing technical rally which helps to renew downside potential. It would need a move above 1.0905 to engage a serious recovery.
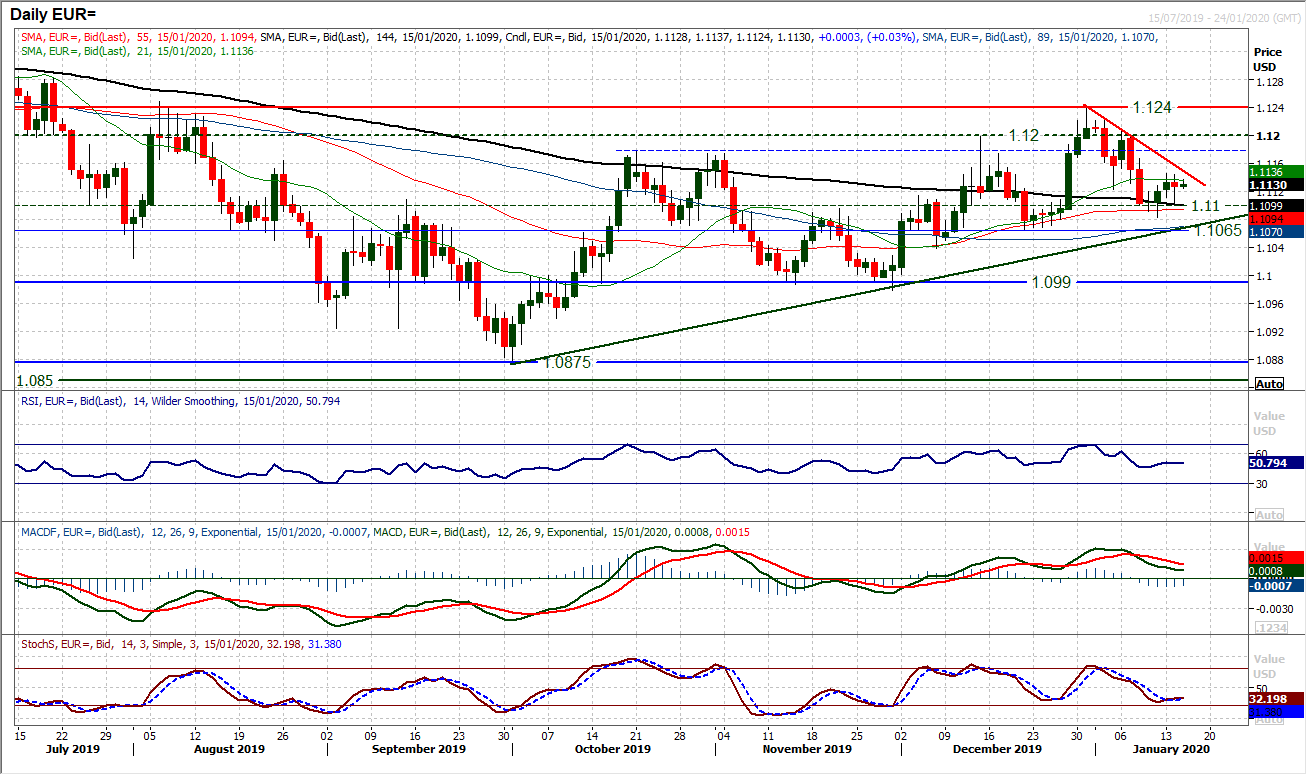
With EUR/USD swinging back mildly lower yesterday the move just adds to what is a growing sense of near term uncertainty. We have recently discussed the trend of higher lows and higher highs in the past few months, whilst momentum indicators keep a mild positive bias. However, what is also notable is the lack of conviction on near term moves which is preventing a decisive trend formation. Accordingly, as the mini rebound struggles to really get going, there is a two week downtrend as a barrier at $1.1150 today. This is restricting a recovery, along with the highs of recent days at $1.1145. On the downside though, once more in yesterday’s session the market was adding to the old pivot support of $1.1100 which maintains a mild bull bias of the outlook. EUR/USD is in a very frustrating moment and the hourly chart shows a lack of decisive direction (hourly RSI oscillating between 30/70). Holding above $1.1065 will sustain the run of higher lows, bull control and also a three month uptrend.
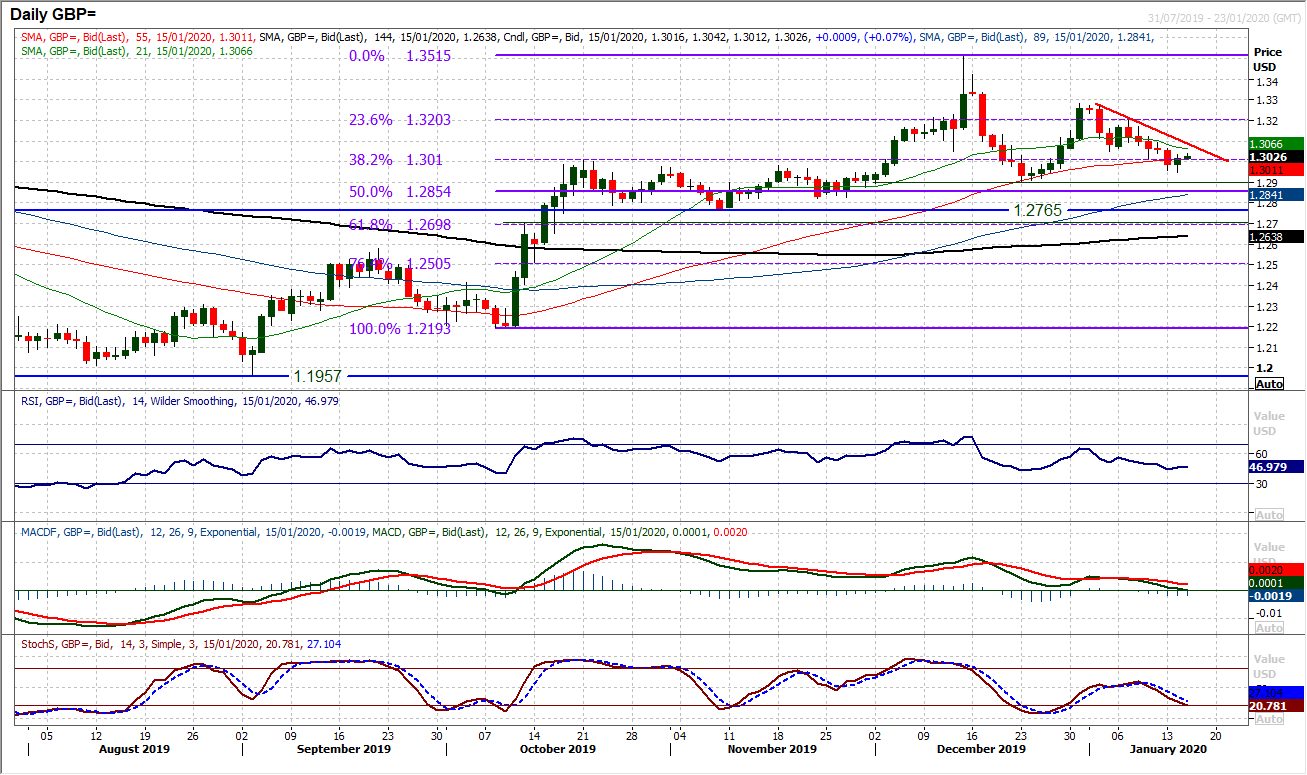
We retain our assessment that Cable will remain positively configured on a medium term basis whilst the support band $1.2900/$1.3010 remains intact. This band has come under some scrutiny as the market has fallen away in recent sessions, but again the bulls seem happy to support and buy into weakness. Yesterday’s rebound into the close left a positive candle with the market again trading above $1.3000. Whilst this has not been a decisive reaction higher yet, it is encouraging. Dovish Bank of England speakers have been a key driver lower, and there is another speech today from Michael Saunders, so if the support band can get through this speech intact this will add to confidence in the support. Technically, the MACD lines are holding above neutral and RSI still above 40. The hourly chart shows already a recovery building as hourly RSI and MACD lines move into an improving near term configuration. There is an initial near term band of support $1.3000/$1.3010 to also build from this morning. A decisive move above $1.3050 would build on the recovery and open $1.3090 and $1.3125 as next resistance.
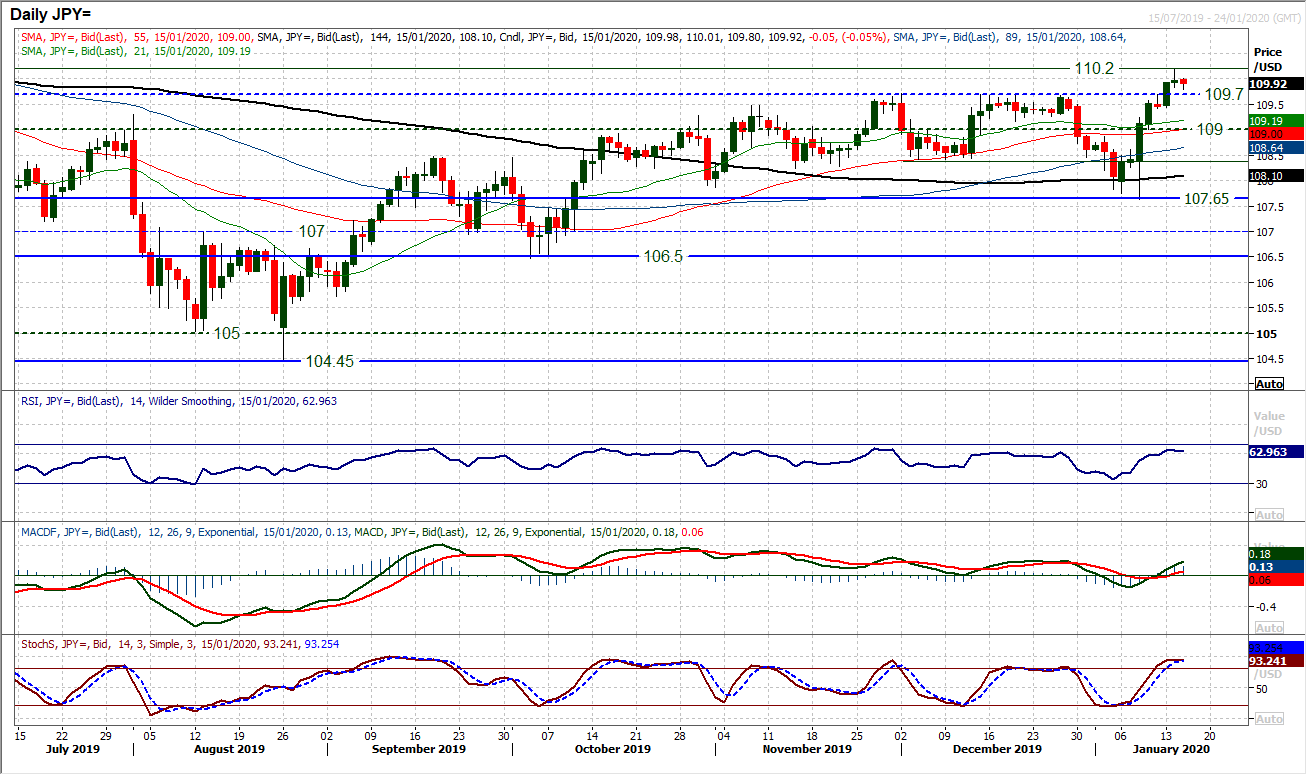
The bulls are still looking at the breakout above 109.70 and hoping for conviction in the move to develop. With momentum indicators all around their medium term turning points, this is still not a breakout that can be taken for granted. Yesterday’s only mild gain on the day, along with an early slip back this morning will not help to settle the nerves either. We have noted recently that in the past four months, all of the breakouts have been followed by retracements. Often there will be maybe 30/50 pips of breakout, only to be followed by a corrective slip back again. Yesterday’s high of 110.20 runs the risk of being another near term peak. Momentum indicators are losing their impetus again, with the RSI tailing off between 60/65, whilst similarly the Stochastics are rolling over and MACD lines are losing momentum. Watch support at 109.70 initially, as a closing breach would be a disappointment now. The hourly chart shows hourly RSI around 40 and MACD lines around neutral. Breaching these levels would add to the corrective momentum threatening this morning. A move back above 110.20 would dispel fears of an unwind and re-open 110.65.
Gold
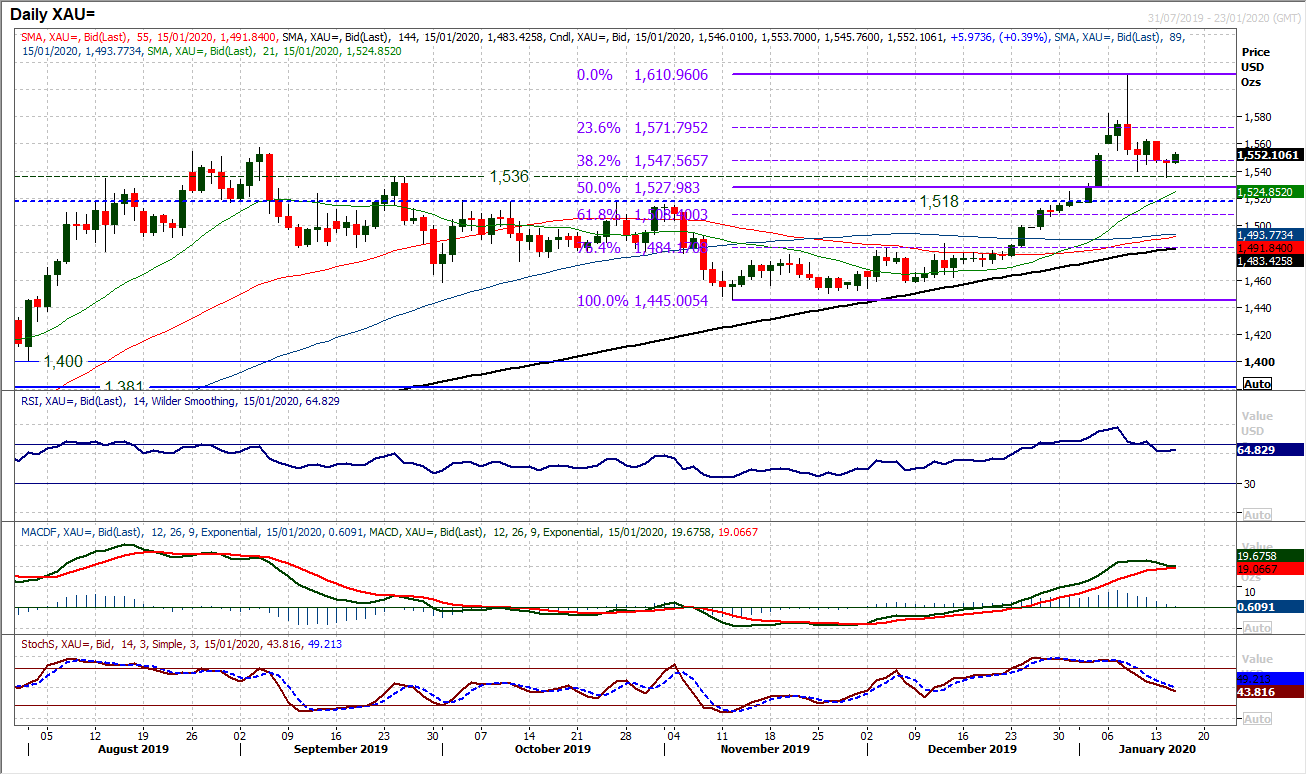
The momentum of the retracement from a multi-year high of $1610 has just stalled in recent sessions. Whilst the market closed lower yesterday, a decent rebound into the close has helped to steady the ship slightly. There is still a negative bias to the move over the past week, with yesterday’s low at $1536 being a lower low to the lower high of $1563. Momentum indicators have unwound, but have begun to steady slightly. This is reflected well through the hourly chart where momentum indicators are now oscillating in ranging configuration and moving averages are broadly neutral too. We continue to see this move as being a near term correction within what is still a positive medium term outlook on gold. The bulls would be looking to post a higher low between the 50% Fibonacci retracement (at $1528) and 38.2% Fib (at $1548). So given the low at $1536 was also an old breakout support, this is an interesting development on gold. A move back above $1563 would be a bullish signal now.
WTI Oil
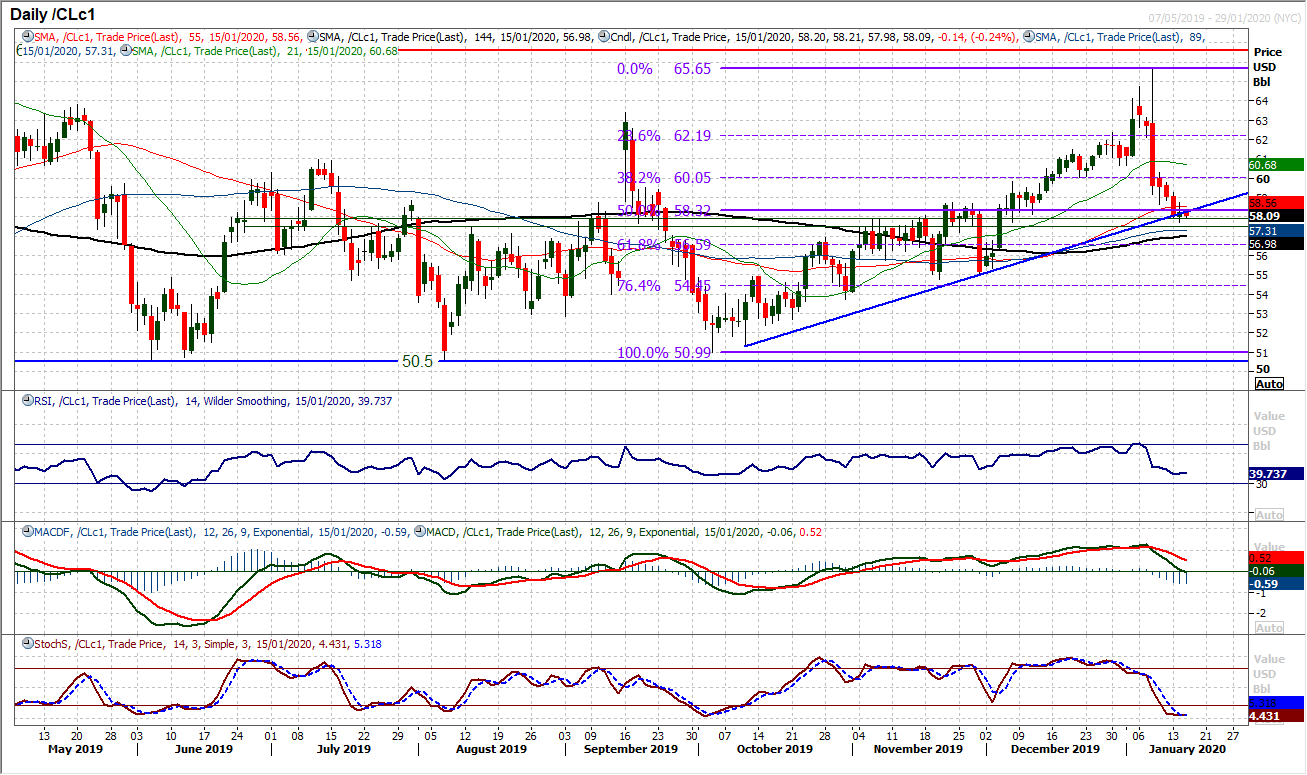
The bulls may have been slightly disappointed in only a mild gain on the day yesterday, however, it could be just the start of a recovery. For more than a week the oil price has been posting a succession of bearish candles, but this sequence has now been broken. It is coming at an important moment too. The support of a three month uptrend is at $58.25 today, but there is also a medium term pivot band support area between $57.50/$57.85 which is now building again. This is coming just as the MACD lines have unwound back to a level around 40 where the bulls have tended to regain control again in recent months. This is a key crossroads now for the market. So whilst the bulls have tentatively looked to build support, the renewed recovery is by no means certain. The hourly chart shows there is a near term pivot at $58.75 as initial resistance, but it would need a move back above $60.00 to really suggest traction in a recovery. Below $57.50 opens $55.00.
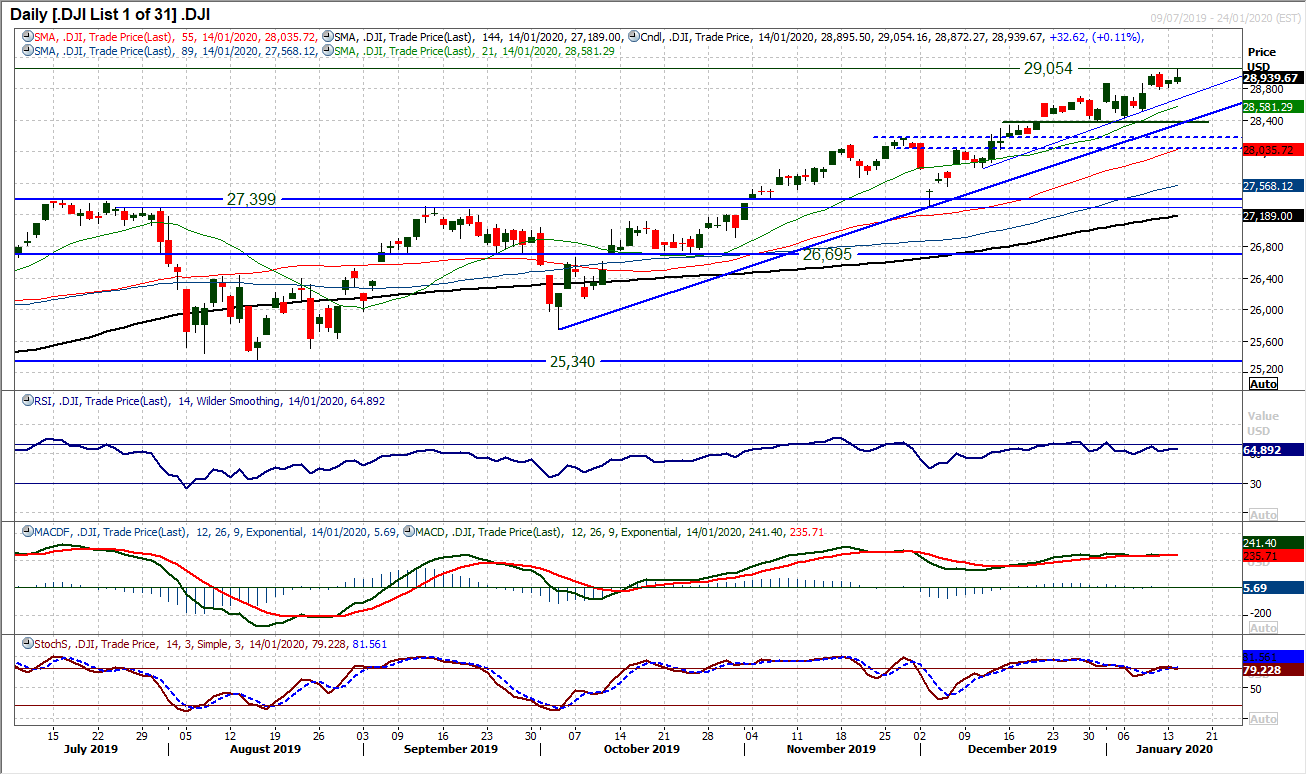
There is a slightly uncertain feel developing to the Dow bull run right now. The outright negative implications of last Friday’s bearish engulfing candle may have been aborted by yesterday’s move to an intraday all time high (peaking at 29,054) but another very tentative close to the session. Momentum indicators have also lost some of their positive intent too, with the MACD lines flattening off and RSI hovering under 70. To be fair though, it is probably still just the bulls having a pause for breath as all of the main positive arguments are still firmly intact, and certainly on a medium term basis. A five week uptrend comes in at 28,670 today, flanked closely by a three month uptrend at 28,350. All moving averages are rising in bullish sequence and any corrective move that may set in would still simply be seen as a bull market correction. Friday’s low at 28,789 is initial support, with the first real support is at 28,376.
DISCLAIMER: This report does not constitute personal investment advice, nor does it take into account the individual financial circumstances or objectives of the clients who receive it. All information and research produced by Hantec Markets is intended to be general in nature; it does not constitute a recommendation or offer for the purchase or sale of any financial instrument, nor should it be construed as such.
All of the views or suggestions within this report are those solely and exclusively of the author, and accurately reflect his personal views about any and all of the subject instruments and are presented to the best of the author’s knowledge. Any person relying on this report to undertake trading does so entirely at his/her own risk and Hantec Markets does not accept any liability.
Related Articles

The US Dollar Index rallied sharply into inauguration day. Since then, it’s been very weak. Could things get worse for King Dollar? Today, we share a “weekly” chart highlighting a...

AUD/USD nears key uptrend resistance as risk appetite surges GBP/USD clears 200DMA, momentum skewed higher despite overbought risks Germany and China ramp up fiscal stimulus,...

EUR/USD is trading at 1.08 following gargantuan moves in European yields. At the current level, the pair is only 1.2% overvalued in our calculation, and we’d be cautious to pick a...
Are you sure you want to block %USER_NAME%?
By doing so, you and %USER_NAME% will not be able to see any of each other's Investing.com's posts.
%USER_NAME% was successfully added to your Block List
Since you’ve just unblocked this person, you must wait 48 hours before renewing the block.
I feel that this comment is:
Thank You!
Your report has been sent to our moderators for review



Add a Comment
We encourage you to use comments to engage with users, share your perspective and ask questions of authors and each other. However, in order to maintain the high level of discourse we’ve all come to value and expect, please keep the following criteria in mind:
Perpetrators of spam or abuse will be deleted from the site and prohibited from future registration at Investing.com’s discretion.