Get 40% Off
🚨 Volatile Markets? Find Hidden Gems for Serious Outperformance
Find Stocks Now

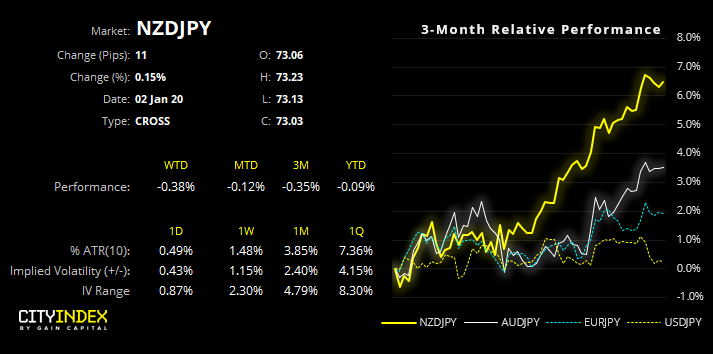
NZD/JPY And AUD/JPY Are Coiling Just Off Their Highs

Published 02/01/2020, 08:36
Updated 14/12/2017, 10:25
NZDJPY Chart

Assuming we don’t see a repeat of January 2019’s yen flash-crash, we’re looking for these pairs to extend their bullish trends.

It was one year tomorrow that JPY pairs exhibited extreme volatility in a low liquidity environment. Given that Japanese exchanges will remain closed until Monday, liquidity is expected to remain low for the remainder of the week during Asian hours which could leave JPY pairs vulnerable to another flash-crash. But hopefully, prices will continue to coil and wait for volumes to return, before extending their trends.
NZDJPY Daily Chart

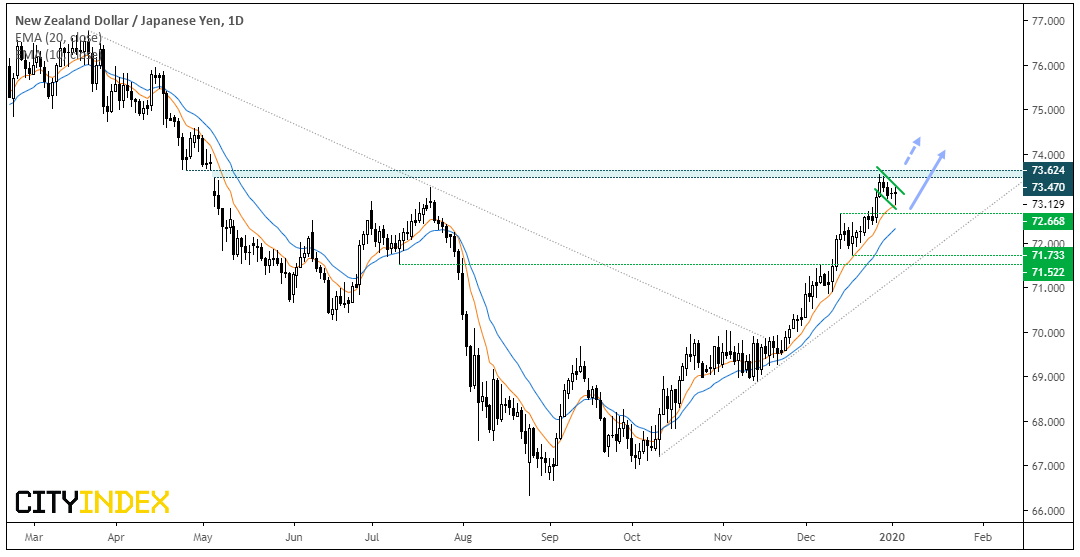
NZD/JPY: The trend remains firmly bullish and prices have found support above the 10-day eMA. It could be argued that it requires a deeper pullback but, until price action presents us with one, we’re to assume the trend will remain in place. With prices coiling up in a potential bull-flag formation, we’re looking for this to break higher.

However, take note that gap resistance between 73.47-73.62 has so far been respected, so we’d prefer to see a break above this resistance zone before assuming trend continuation.
  • Trend remains bullish above 71.73 but bulls could consider dips above 72.67 support (as this could allow for a better reward to risk ratio heading into 73.62 resistance)
  • Alternatively, bulls could wait for a break above 73.62 and keep an open upside target in line with the dominant trend.
  • AUD/JPY Daily Chart

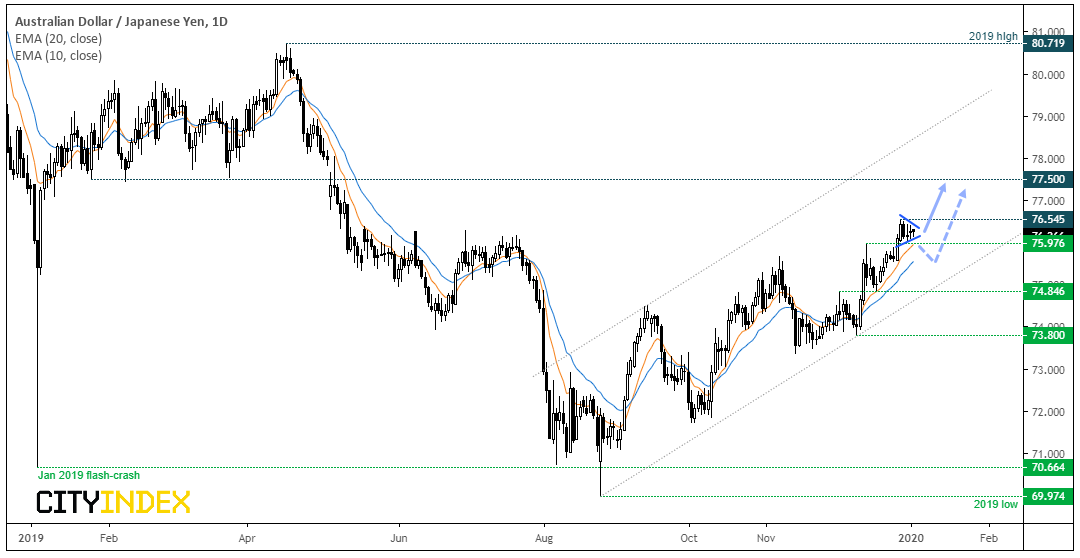
    AUD/JPY: Whilst its advance has not kept up at the same pace of NZD/JPY, AUD/JPY is trading within a bullish channel and now coiling up near the highs. With it holding above the 10 and 20-day eMA’s, we’re also looking for this to break higher.

    3rd party Ad. Not an offer or recommendation by Investing.com. See disclosure here or remove ads .

  • Near-term bias remains bullish above 75.98 support
  • A break below 75.98 warns of a deeper retracement, and the daily trend remains bullish above the lower bullish trendline and / or the 74.85 low.
  • Initial target is around 77050, near a cluster of prior support levels.
  • "Disclaimer: The information and opinions in this report are for general information use only and are not intended as an offer or solicitation with respect to the purchase or sale of any currency or CFD contract. All opinions and information contained in this report are subject to change without notice. This report has been prepared without regard to the specific investment objectives, financial situation and needs of any particular recipient.

    Any references to historical price movements or levels is informational based on our analysis and we do not represent or warrant that any such movements or levels are likely to reoccur in the future. While the information contained herein was obtained from sources believed to be reliable, the author does not guarantee its accuracy or completeness, nor does the author assume any liability for any direct, indirect or consequential loss that may result from the reliance by any person upon any such information or opinions."

    Original Post

    Latest comments

    Risk Disclosure: Trading in financial instruments and/or cryptocurrencies involves high risks including the risk of losing some, or all, of your investment amount, and may not be suitable for all investors. Prices of cryptocurrencies are extremely volatile and may be affected by external factors such as financial, regulatory or political events. Trading on margin increases the financial risks.
    Before deciding to trade in financial instrument or cryptocurrencies you should be fully informed of the risks and costs associated with trading the financial markets, carefully consider your investment objectives, level of experience, and risk appetite, and seek professional advice where needed.
    Fusion Media would like to remind you that the data contained in this website is not necessarily real-time nor accurate. The data and prices on the website are not necessarily provided by any market or exchange, but may be provided by market makers, and so prices may not be accurate and may differ from the actual price at any given market, meaning prices are indicative and not appropriate for trading purposes. Fusion Media and any provider of the data contained in this website will not accept liability for any loss or damage as a result of your trading, or your reliance on the information contained within this website.
    It is prohibited to use, store, reproduce, display, modify, transmit or distribute the data contained in this website without the explicit prior written permission of Fusion Media and/or the data provider. All intellectual property rights are reserved by the providers and/or the exchange providing the data contained in this website.
    Fusion Media may be compensated by the advertisers that appear on the website, based on your interaction with the advertisements or advertisers.
    © 2007-2024 - Fusion Media Limited. All Rights Reserved.