
- All Instrument Types
- Indices
- Equities
- ETFs
- Funds
- Commodities
- Currencies
- Crypto
- Bonds
- Certificates
Please try another search

Mild Positive Bias As Markets Prepare For Trade Talks Volatility

Market Overview
The sensitivity to newsflow surrounding the US/China trade talks is significant now. Conflicting snippets are coming out of US and Chinese sources over the progress of the low level talks have driven fluctuations in US futures overnight. The is speculation from China that no progress has been made so far and that but also that Vice Premier Liu He could leave a day early, but also that China will accept a partial trade deal. However, there is more encouraging speculation coming from the US that suggests President Trump may be ready to postpone tariff increases next week in exchange for a currency pact. There is also the potential that President Trump could allow US companies to supply certain components to Huawei.
It seems that there is a lot to sift through and iron out, but essentially, markets are mildly risk positive today, but still on tenterhooks waiting for something more definitive. Across major markets there is an increasing consolidation as markets such as EUR/USD, gold and oil have all formed holding patterns. Traders are ready to take direction from the trade talks. An agreement to at least postpone the tariff increases next week would hold off the bears from regaining control, but for longer term risk recovery there would need to be some sort of bedrock deal over trade that markets see as a firm stepping stone towards something more substantial. Anything that is just words based with a commitment to talk again will likely see risk appetite dwindle fairly quickly once more.
Wall Street closed with decent gains yesterday, with the S&P 500 +0.9% higher at 2919. US futures have fluctuated overnight but are currently just a shade below flat at -0.1%. Asian markets have been trading slightly positive with the Nikkei +0.5% and Shanghai Composite +0.6%. European futures are also looking decent today, with FTSE futures +0.2% and DAX futures +0.2%.
In forex, there is a mild risk positive move, with EUR higher, along with AUD and NZD, whilst JPY and USD are the main underperformers. In commodities, there is an early consolidation on gold, whilst oil is mildly lower.
Aside from the newsflow from the US/China trade talks, the economic calendar also contains a few key entries. A raft of tier one UK data is at 0930BST, with UK monthly GDP keenly watched. Forecasts have a flat month with 0.0% in August (+0.3% in July) which would be a year on year growth of +0.9% (+1.0% in July). UK Industrial Production is expected to have fallen by -0.1% in August (+0.1% in July) which would leave the year on year at -0.9% (-0.9% in July). The UK Trade Balance is expected to deteriorate to a deficit of -£10.0bn (from -9.1bn). US CPI is at 1330BST and is expected to show headline CPI remaining at +1.8% in September (+1.8% in August) whilst core CPI is expected to stay at +2.4% (+2.4% in August). The US Weekly Jobless Claims are expected to remain at 219,000 (219,000 last week).
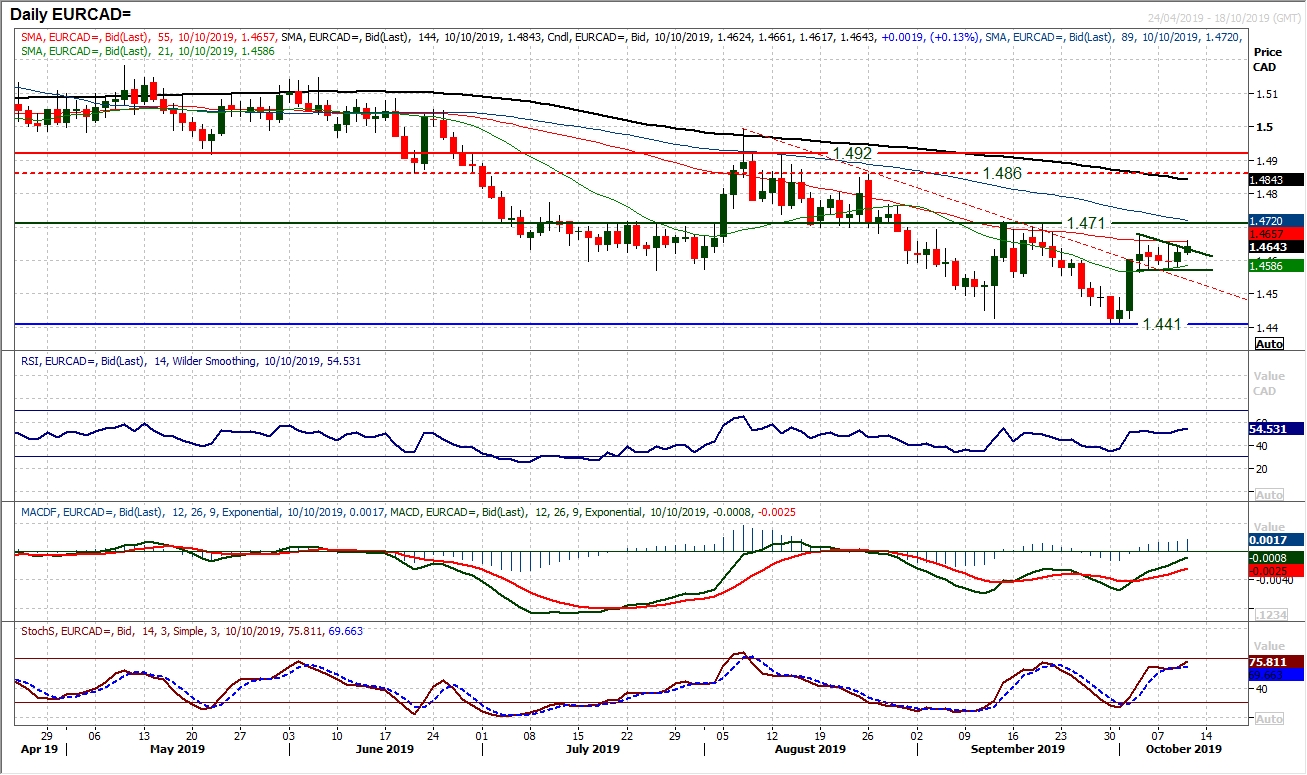
Chart of the Day – EUR/CAD
There is an interesting improvement coming through on EUR/CAD. Having trended lower since early August, last week saw the downtrend breached. A number of indecisive candles have followed, but now with a positive candle yesterday and an early push on this morning, this looks to be a market preparing for the next leg higher. This now means that the resistance at 1.4675 is important for the market to breakout and complete a bull flag. It would imply a move towards 1.4800 in due course. The key resistance comes in at the September high of 1.4715 with a pivot of the past three months at 1.4710. Momentum indicators are continuing to improve with the RSI rising above 50, MACD lines advancing at six week highs and Stochastics still rising encouragingly. Weakness looks to be a chance to buy, with support at 1.4565.
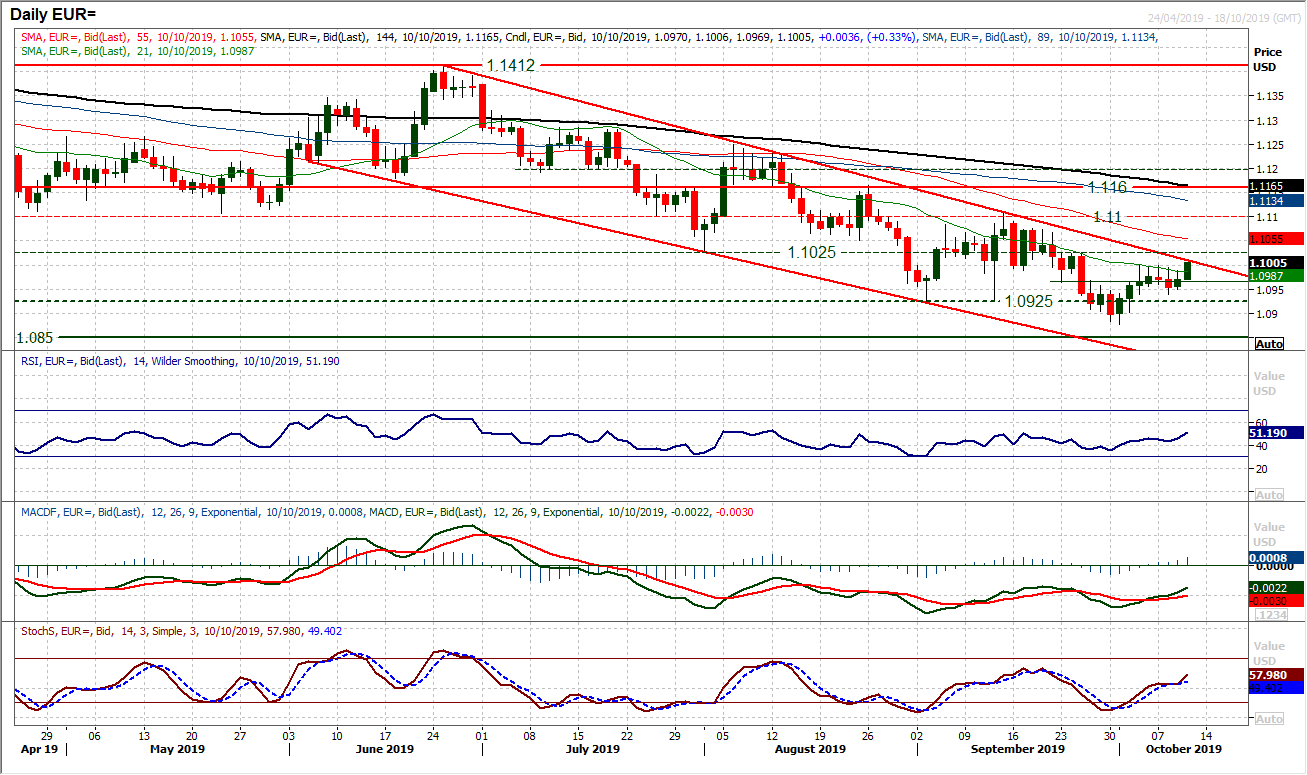
The euro has edged higher again to restrict selling pressure, but this is a market still in consolidation. Over the past week EUR/USD has been stuck in a 60 pip range $1.0940/$1.1000. However, this has the sense of a market at an important crossroads. Given the US/China trade talks are likely to be a key driver near term, this could have an outlook defining impact. Medium term signals are at crucial levels once again. The bulls are bumping up against their medium term limiting factors. A confluence of resistance lies between $1.1000/$1.1025, with the 21 day moving average (at $1.0985), near term resistance ($1.1000), three and a half month downtrend channel (today $1.1010) and old pivot at $1.1025. The RSI is again close to 50, where the near term rallies have repeatedly failed over recent months. So a failure here would leave the market believing it was time for the downtrend channel to resume. Support at $1.0940 being breached on a closing basis would be a trigger. For the bulls, a close above $1.1025 is needed to change the outlook. For now though, consolidation continues.
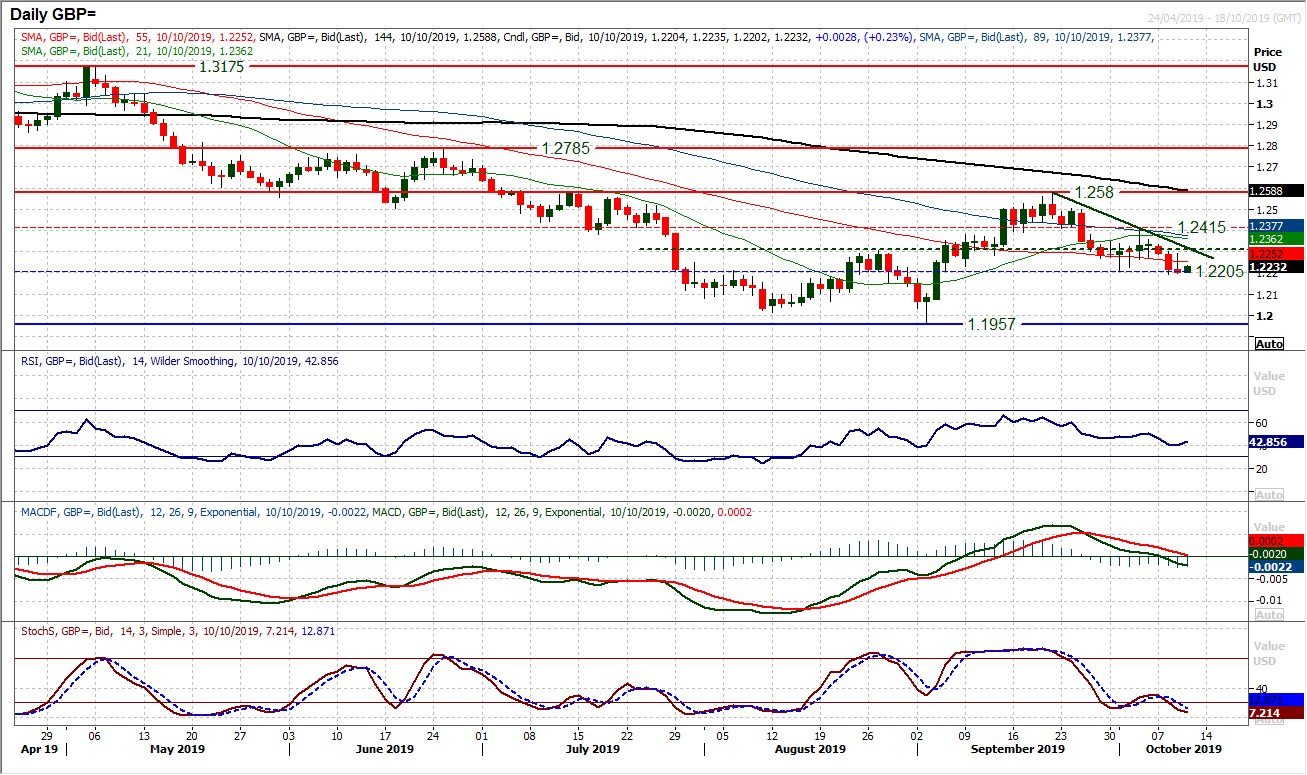
Although the euro is gaining ground against the dollar, sterling continues to struggle with the politics of Brexit. Yesterday’s candle simply confirmed that rallies need to be treated as a chance to sell. The bull failure of closing all but at the low of a 95 pip range candle has reiterated the three week trend lower. The pressure is once more growing on the support around $1.2200 that has been a feature of the past few sessions. For now this is a support hanging on, but deteriorating momentum indicators reflect the growing pressure. MACD lines are now falling below neutral whilst Stochastics are back in bearish configuration and if the RSI closed below 40 it would really reflect the market breaking lower. A close below $1.2200 opens a move that would likely end with a test of $1.2000 again. The US/China trade talks are likely to create some near term volatility but we remain sellers into strength on Cable. Resistance in the band $1.2270/$1.2330.
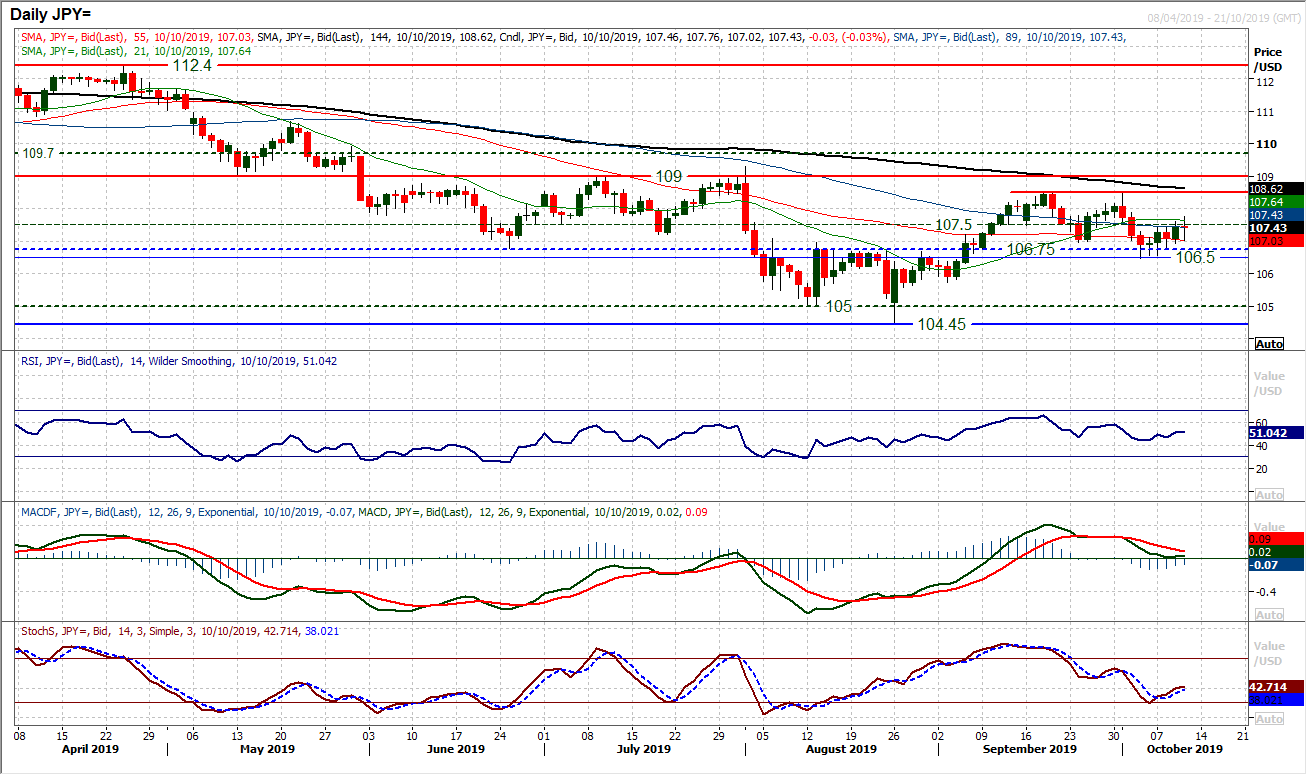
The outlook for the USD/JPY remains mixed as the run of contradictory candles continues. The market continues to trade within the trading band of around 200 pips, with support 106.50/106.75 and the recent failures a shade under 108.50. However, there is a mid-range pivot at 107.50 which the market is now just edging above. The question is whether a mild improvement in the (sensitive) Stochastics and RSI is a suggestion of improving momentum to be backed. Having consistently tested the 106.50/106.75 support, the market has now posted three successive higher lows and is beginning to edge higher. However, given the lack of conviction in the technical signals and the drift back into the middle of the recent range, it is still a market looking for direction. Perhaps given the importance of the trade talks today and tomorrow, this should be expected.
Gold
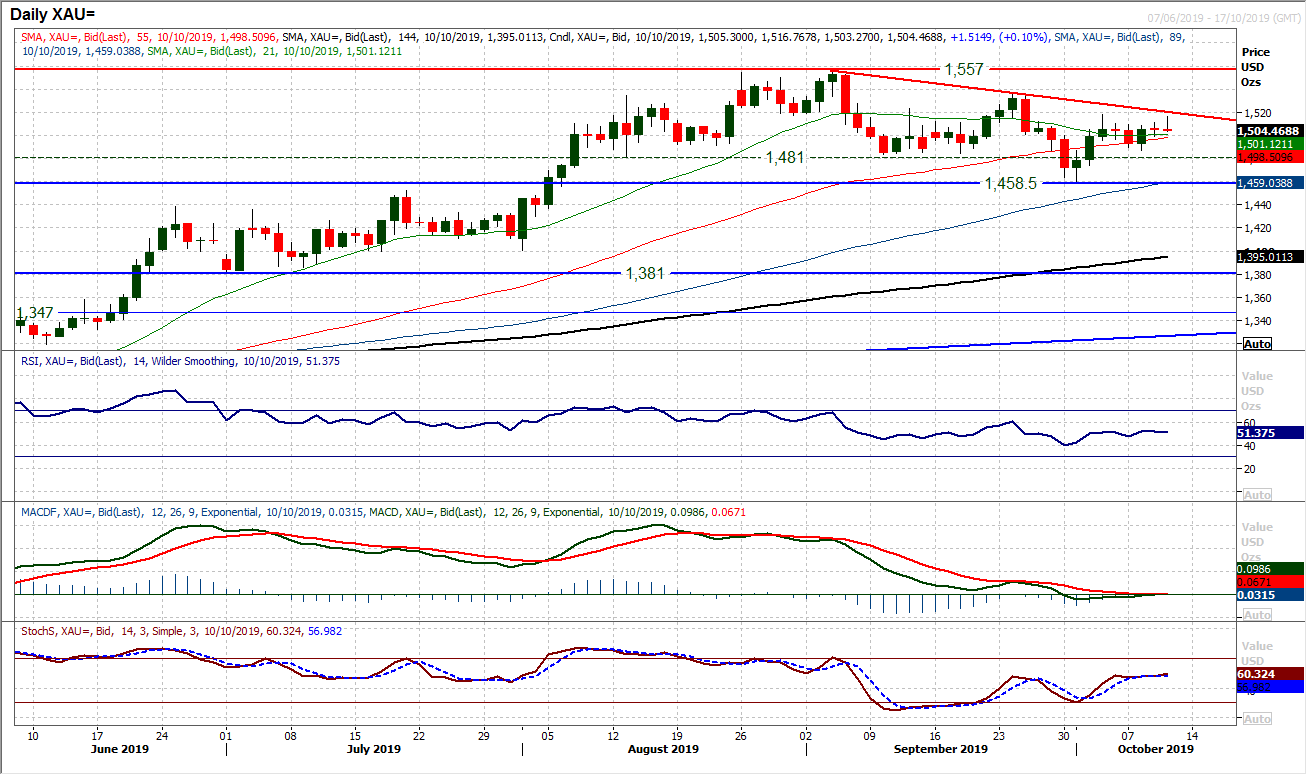
Gold is a market seen as a key gauge of risk appetite and the outlook for the dollar. So given the importance of the latest round of US/China trade talks, a $12 (ie. small) daily range (the Average True Range has been above $20 for the past three months) with a doji candle around the mid-point, should not be unexpected. This is a market waiting for a catalyst. Yesterday was another session where the $1500 level has been traded, but there has been a slight pick up today in the lead up to the trade talks. Momentum is a shade above neutral across our signals, but the resistance of the one month downtrend falls at $1520 today and $1518.50 also remains as a barrier. There is a sense that the bulls are ready to talk hold once more, but this has to be a wait and see moment for now.
WTI Oil
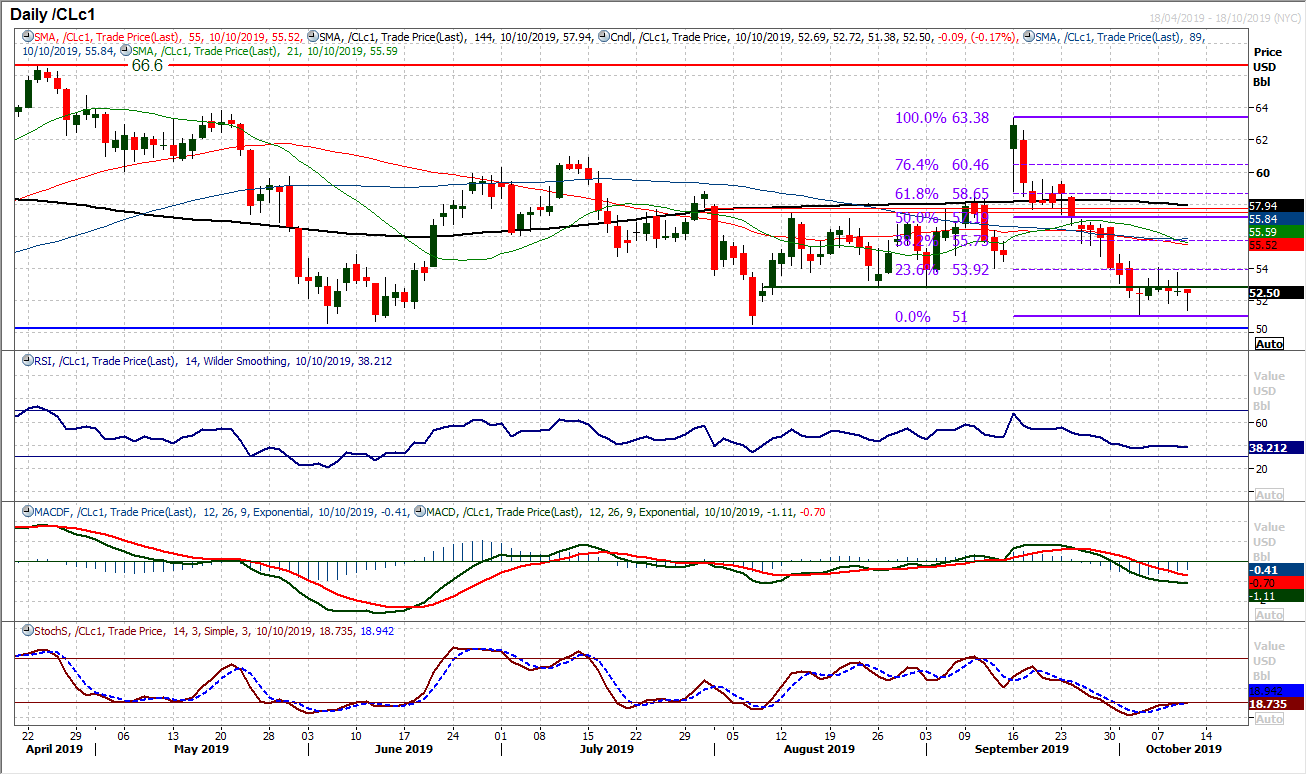
The candlesticks on the daily chart are a real mix of intraday failures. In the past five sessions the oil price has flown higher and lower, only to close around the flat line on the day. This is leaving a lot of long tailed, small bodied but also contradictory candlesticks, which tell us very little, other than a market of uncertainty. The hourly chart gives a sense of consolidation with the market in a range now. Fluctuations between 30/70 on hourly RSI and trading around converged and flattened moving averages. Importantly, though it seems that the market has alleviated the selling pressure and this is strengthening the support between $50.50/$51.00. Despite this though, yet again the resistance around $54.00 with the 23.6% Fibonacci retracement of $63.40/$51.00 at $53.90 held firm. Negative momentum has also settled down and this is a market in need of decisive direction (yes, another one).
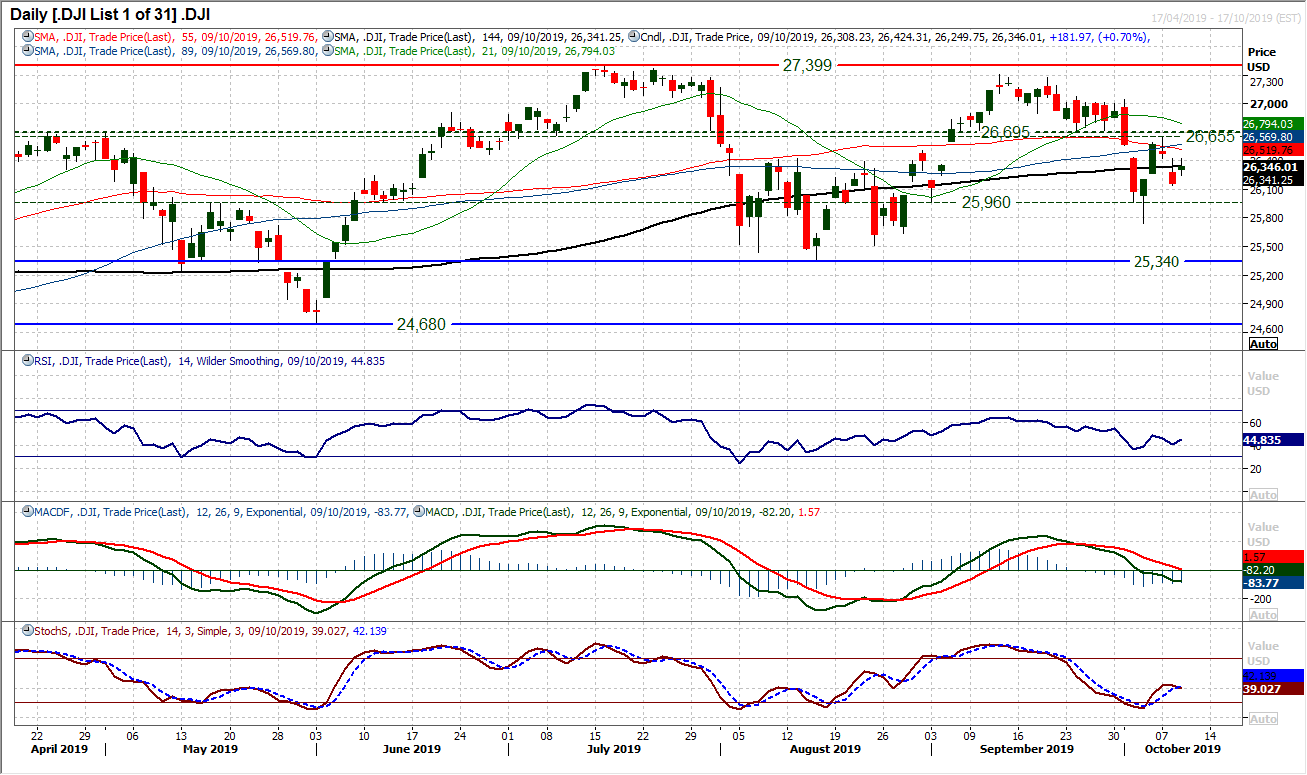
The near term outlook is rather uncertain. Anyone looking at the movements on US futures overnight will know that we could be in for a rough ride in the next couple of days as the US/China negotiations play out. Within that context, yesterday’s positive close will have been quite a relief for the bulls. However, given the rollercoaster of the past week and a half, this is a market that will trade with almost no conviction until we see a definitive outcome from this round of trade talks. A rebound higher has left support at 26,140 as a higher low above the band 25,743/25,960. However, the market again failed almost to the tick at the 26,425 gap resistance and on a technical basis, this is negative. Momentum indicators are flattening off with the recent daily fluctuations, so we look to the trade talks for direction. Resistance at 26,655/26,695 remains key.
"""DISCLAIMER: This report does not constitute personal investment advice, nor does it take into account the individual financial circumstances or objectives of the clients who receive it. All information and research produced by Hantec Markets is intended to be general in nature; it does not constitute a recommendation or offer for the purchase or sale of any financial instrument, nor should it be construed as such.
All of the views or suggestions within this report are those solely and exclusively of the author, and accurately reflect his personal views about any and all of the subject instruments and are presented to the best of the author’s knowledge. Any person relying on this report to undertake trading does so entirely at his/her own risk and Hantec Markets does not accept any liability. """
Related Articles

In response to criticism of tariff 'confusion', President Trump stepped in emphatically yesterday to announce that tariffs would be going ahead on Canada, Mexico, and China next...

Trump said yesterday that tariffs on Mexico and Canada are still on the table ahead of next Monday’s deadline. Markets remain reluctant to price that in for now, and some soft US...

GBP/USD is making another attempt to push past the 1.25 level, buoyed by stronger-than-expected UK GDP data. The preliminary report suggests the UK economy grew by 1.5% in 2024, a...
Are you sure you want to block %USER_NAME%?
By doing so, you and %USER_NAME% will not be able to see any of each other's Investing.com's posts.
%USER_NAME% was successfully added to your Block List
Since you’ve just unblocked this person, you must wait 48 hours before renewing the block.
I feel that this comment is:
Thank You!
Your report has been sent to our moderators for review



Add a Comment
We encourage you to use comments to engage with users, share your perspective and ask questions of authors and each other. However, in order to maintain the high level of discourse we’ve all come to value and expect, please keep the following criteria in mind:
Perpetrators of spam or abuse will be deleted from the site and prohibited from future registration at Investing.com’s discretion.