Stocks are rebounding for a second straight day as risk sentiment continues to improve on tentative signs that coronavirus cases are levelling off.
In the UK, the number of coronavirus cases and deaths dropped by a third on Monday. Statistics point to a levelling off in New York and in hotspots in Europe as well. Gains are lacking the momentum from the previous session but perhaps that isn’t so surprising given the size of Monday’s surge and the size of the economic hit which is expected over this quarter.
The FTSE is pointing to a 1.5% jump on the open after soaring over 3% in the previous session. On Monday, the UK index booked impressive gains despite awful data. Consumer confidence plummeted to 2008 levels on the coronavirus lock down. Data also showed that UK construction firms axed jobs at the fastest pace in a decade, and Goldman Sachs (NYSE:GS) forecast the deepest recession in the UK in a century.
Risk sentiment tops macro data
The fact that the FTSE can advance despite the terrible data tells us that right now risk sentiment is more important than macro data. Risk sentiment is interested in coronavirus statistics and ultimately when lock downs across the globe can end. The sooner the lock down’s halt or ease, the sooner the recovery can begin.
And the exit strategy?
However, there are growing concerns over the UK’s exit strategy. Testing here so far has been a complete failure. As we move past the coronavirus peak more attention will turn to plans to end the lockdown. The lack of a solid exit strategy could hit sentiment.
GBP rebounds as Boris remains in ICU
A stronger pound means the FTSE is slightly lagging its European peers in early trade. The Pound is rebounding despite Boris Johnson’s admission to the ICU at St Thomas’ Hospital. The government’s plan aimed at calming the public as the UK moves towards its peak in the coming days appears to be working.
Levels to watch
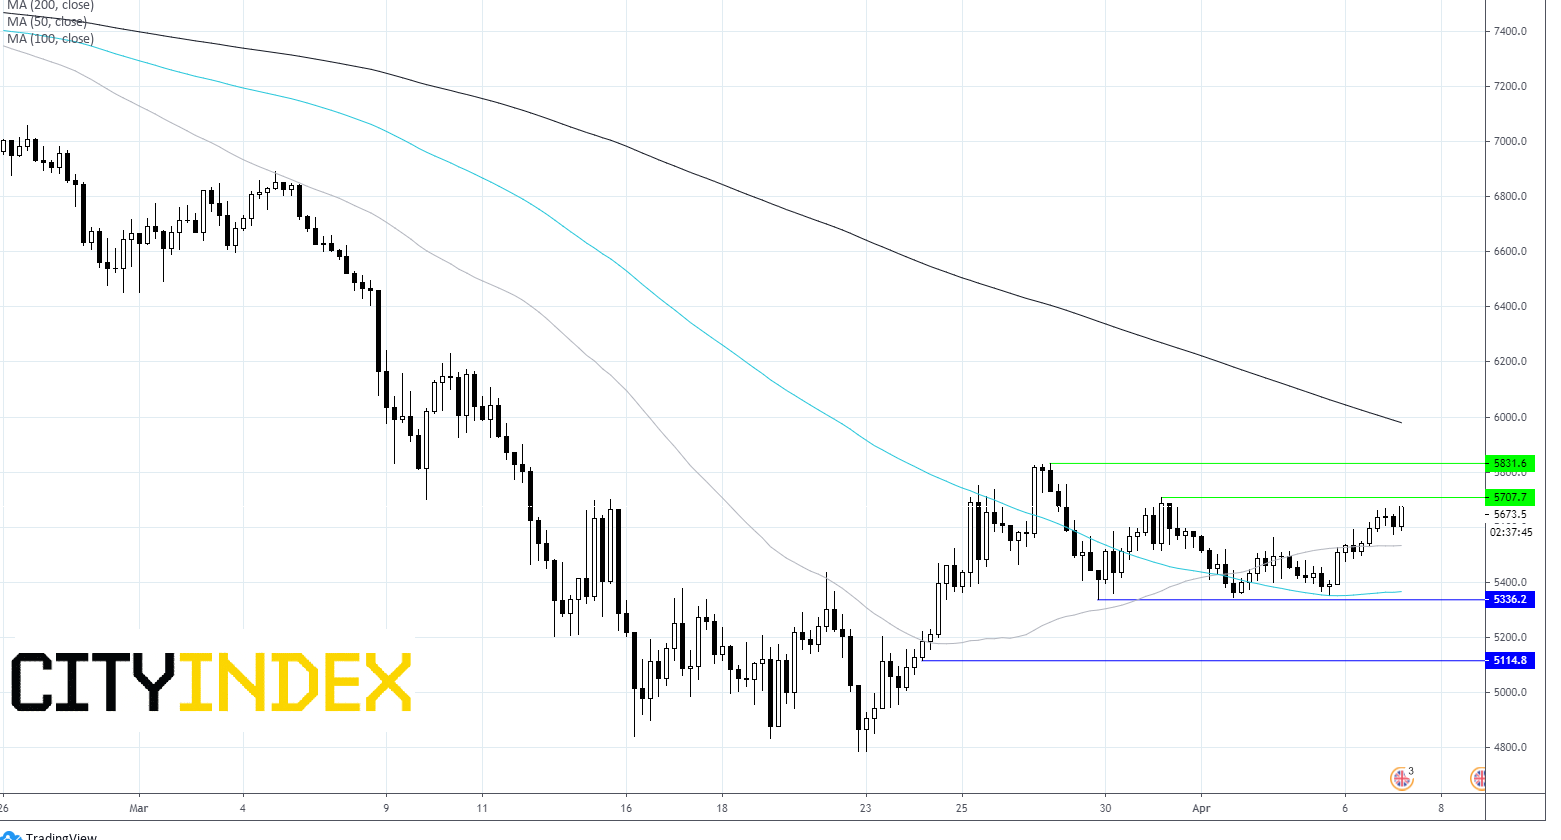
The FTSE futures are pointing to a 1.5% jump on the open. The UK index trades above its 50 & 100 sma on the 4 hour chart. The price action remains within a horizontal channel since 25th March.
Immediate resistance can be seen at 5707 (high 31st March) prior to 5830 (high 26th March) a move beyond this level could see more bulls jump in.
Support can be seen at 5530 (50 sma) prior to 5360 (100 sma) and 5330 (lower bound on the channel).
"Disclaimer: The information and opinions in this report are for general information use only and are not intended as an offer or solicitation with respect to the purchase or sale of any currency or CFD contract. All opinions and information contained in this report are subject to change without notice. This report has been prepared without regard to the specific investment objectives, financial situation and needs of any particular recipient.
Any references to historical price movements or levels is informational based on our analysis and we do not represent or warrant that any such movements or levels are likely to reoccur in the future. While the information contained herein was obtained from sources believed to be reliable, the author does not guarantee its accuracy or completeness, nor does the author assume any liability for any direct, indirect or consequential loss that may result from the reliance by any person upon any such information or opinions."
