


Sign up to create alerts for Instruments,
Economic Events and content by followed authors
Free Sign Up Already have an account? Sign In
Please try another search

The last 11 years have proved to be very positive for stock indices. The Nasdaq grew by 558% and S&P 500 by nearly 300%. Spectacular increases do not inhibit, and appreciation begins to resemble the situation on Bitcoin at the end of 2017.
The appreciation dynamics is absurdly increasing
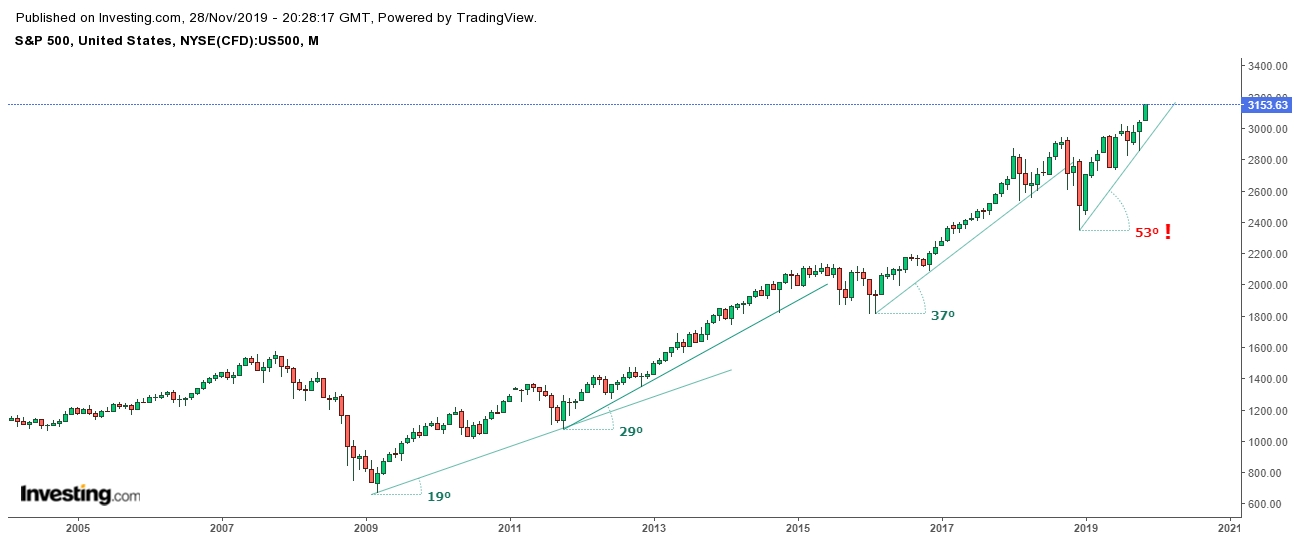
Over the years, with ever-higher valuations on stock market indices, the appreciation dynamics should inherently drop. When the opposite happens, the situation becomes dangerous for shareholders and reminds us of typical speculative bubbles that took place, e.g. on Bitcoin in 2017 or on oil in 2008 and 2011. It should be considered that when the growth dynamics of the trend line exceed 45%, there has always been a speculative bubble and the upward trend is always ended soon after (see charts below).
Currently, on the S&P500 the trend line has reached an abstract slope of 53% (!). It is important that the monthly candles from last year have a record high. Never before has the value of (in points) US indices progressed so quickly. Trade war and the impact on markets over the past two years was topic # 1.
The topic has troubled investors so often, that they stopped paying attention, in which President Donald Trump helped. He has repeatedly assured publicly that the trade deal between China and the United States is certain and that it will be reached in a matter of time. He also explained that it would be a historic, monumental event in history with very good benefits for the US. Due to repeated assurances of the President, investors believe in reaching an agreement, and all stock indexes are valued in euphoria, even though there is no agreement yet.
In light of the above, reaching an agreement should not have a significant positive impact on indexes, because such expectations are already valued. However, any negative information will generate the basis for a very dynamic sale on the stock markets by the largest investment entities, which should now start fighting for the best prices to realise profits from the purchase of shares.
ISM PMI and GDP have been falling strongly in the last year. The impressive increases in US indices do not go hand in hand with significant macroeconomic data. Since September 2018, GDP has been steadily falling from 4.2% q / q up to 2.0% q / q.
ISM Manufacturing PMI fell from 61.3 to 47.8 (!), and ISM Manufacturing PMI fell from 61.6 to 54.7 (52.6 was a month ago).
Considering only those significant readings, there were no grounds for the increase in the value of indices in the last year, and the basis for sales was very strong right now.
To sum up, indexes increases are on the wave of euphoria about the historical deal of the US and China. The trade agreement has been valued for a long time. Macroeconomic data support a long-term downward correction. NASDAQ and S&P 500 growth dynamics are similar to the 2017 Bitcoin increases, just before its huge crash. This is the last time to realise profits from the purchase of shares among developed economies, and the coming years should belong to emerging economies.
Among European stock markets, Poland may be very attractive in the coming years, where the stock market is highly undervalued.
Michael Angel
The Strategic Metals Ready to Skyrocket WisdomTree has launched the WisdomTree Strategic Metals UCITS ETF (WENU), offering investors access to the clean technology and battery...
This year tracks as a record for ETF launches among US issuers Investors have demanded high-yield, protection, and crypto-related funds in 2024 New strategies emerge, including...
What about performance? In the first blog of this two-part series, we analysed the real difference between active ETFs and, let’s say, ‘classic’ ETFs in Europe. We noted two main...
Are you sure you want to block %USER_NAME%?
By doing so, you and %USER_NAME% will not be able to see any of each other's Investing.com's posts.
%USER_NAME% was successfully added to your Block List
Since you’ve just unblocked this person, you must wait 48 hours before renewing the block.
I feel that this comment is:
Thank You!
Your report has been sent to our moderators for review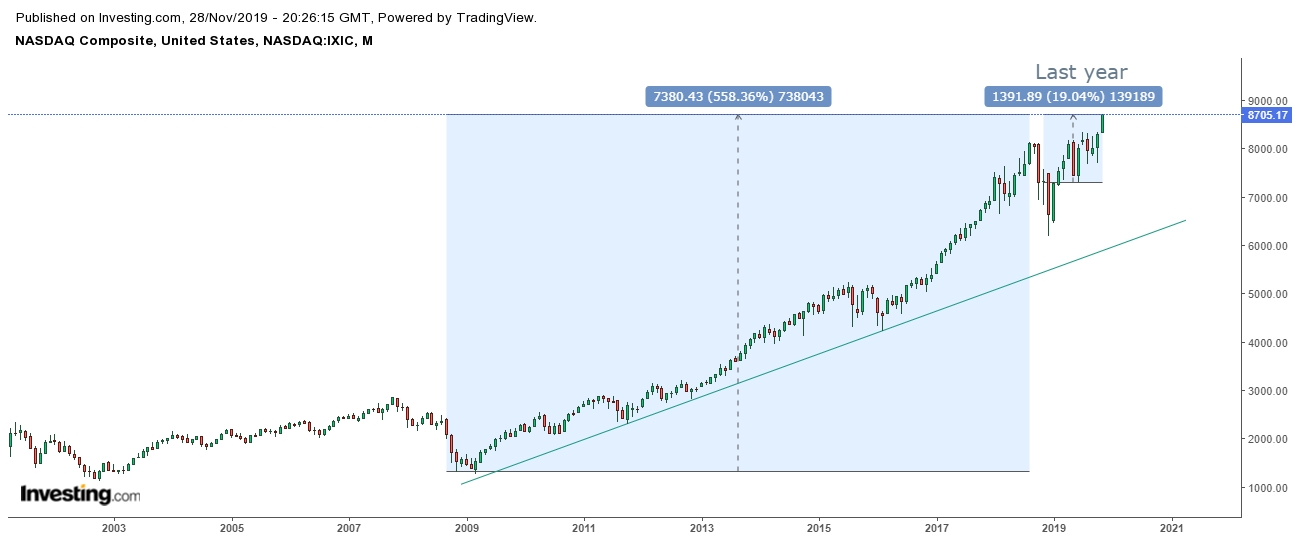

Add a Comment
We encourage you to use comments to engage with users, share your perspective and ask questions of authors and each other. However, in order to maintain the high level of discourse we’ve all come to value and expect, please keep the following criteria in mind:
Perpetrators of spam or abuse will be deleted from the site and prohibited from future registration at Investing.com’s discretion.