Market Overview
The US/China trade dispute is really impacting across the major economies, driving a global slowdown. PMI data from manufacturing sectors paint a starkly gloomy picture of contraction. The question is how long, or whether at all, can the services sectors of these major economies (which still drive the bulk of economic growth) be insulated? With the supply lines negatively impacted, capex programs restricted and new order flows falling, negativity surrounding global growth prospects is growing. The US dollar took a hit yesterday as the ISM Manufacturing data hit its lowest level (47.8) since 2009. Equity markets and Treasury yields fell as investors moved back into the safety of US debt. The yen and gold also jumped. However, it is interesting that the dollar is already starting to regain ground this morning. The US position as the best economy of a bad bunch is still a key factor in the outlook for major forex pairs. It was also notable that the FOMC’s Charles Evans (mild dove) talked about setting rates potentially higher in the coming years. The recent run of dollar strength may have been hit, but trends are intact across major markets. It is worth keeping an eye on sterling volatility today as Prime Minister Johnson gives his conference speech and what is likely to amount to a final offer on an alternative to the Irish backstop is made to the EU. If rejected, it raises the prospects of a “no deal” Brexit once more.
Wall Street closed decisively lower last night on fears of economic slowdown following the ISM data. The S&P 500 was -1.2% at 2940 and whilst US futures have rebounded marginally today (by +0.2%) the move is more of a stabilisation than anything more encouraging. Asian markets slid with the Nikkei -0.5% whilst European markets are set for a continued corrective open with FTSE Futures -0.4% and DAX futures -0.3%. In forex, it seems that USD has stabilised from yesterday’s sharp reversal. It is also notable that GBP is back lower again as UK Prime Minister Johnson prepares his proposal for Brexit to the EU. In commodities the rebound on gold is threatening to roll over. Oil has rebounded again by around 1%, but time and again in recent weeks these intraday rallies have been sold into.
It is a relatively quiet day for the economic calendar today, with the UK Construction PMI first up at 0930BST. Consensus forecasts suggests a continued significant contraction of 45.0 in September (45.0 in August), but also the sector accounts for just around 7% of the UK economy, so the impact on sterling may not be all too great. Into the afternoon, the main focus will be on ADP (NASDAQ:ADP) Employment change at 1315BST. Expectations are that there will be a decline back to 140,000 (down from 195,000 in August). EIA crude oil inventories at 1530BST.
It is also worth keeping an eye out for another Fed speaker today, with John Williams (NYSE:WMB) (voter, centrist) speaking at 1550BST. Given that Williams is a centrist, how he comes across today could be a gauge of how the FOMC may swing in the meetings to come.
Chart of the Day – AUD/JPY
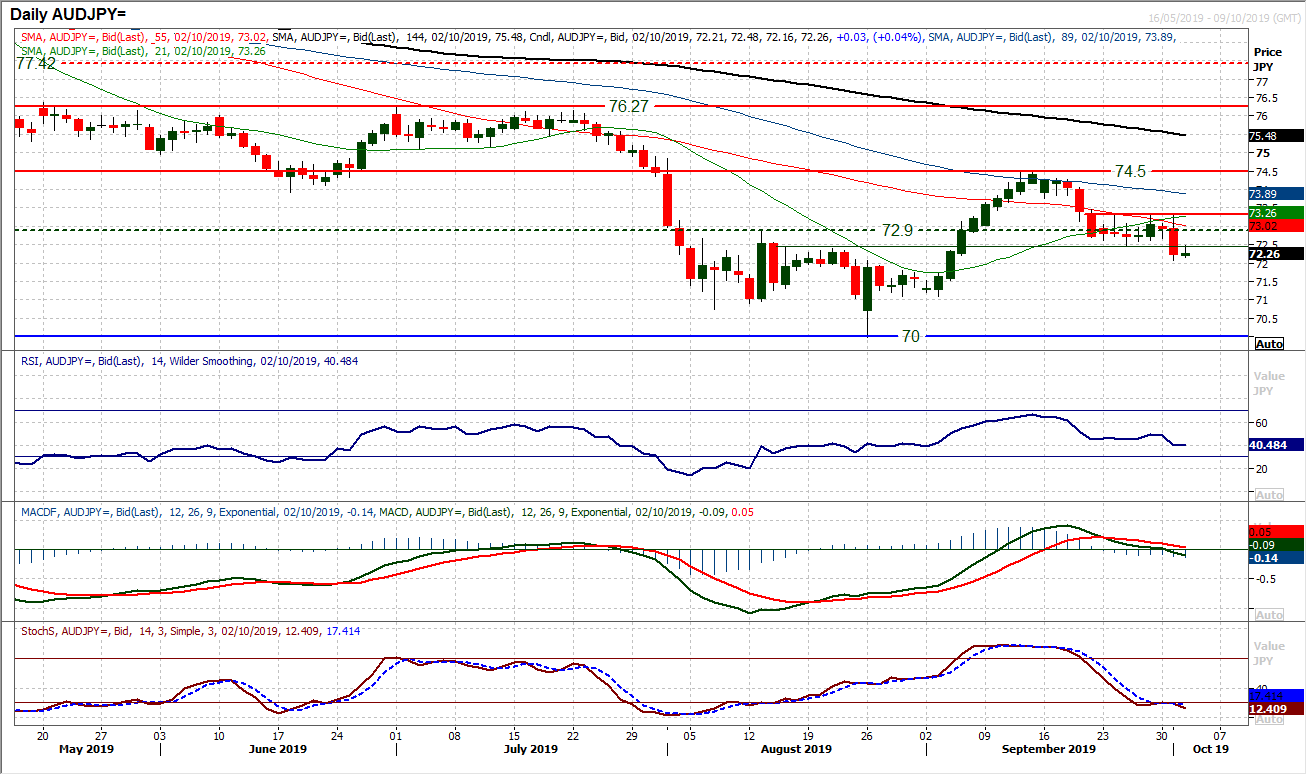
A rate cut by the RBA and a risk aversion shift in the wake of the very weak ISM manufacturing data all adds up to AUD/JPY turning lower. The outlook has been deteriorating since mid-September, but with the support band 72.40/72.90 holding, the sellers needed a catalyst. That was seen in yesterday’s session, with a decisive bear candle which takes the market to a new near four week low. Closing clear of the 72.40 opens the next support band as 70.00/71.00 for the next target area. The move is being confirmed by a continuation of the momentum deterioration. RSI is falling below 40, whilst Stochastics are in bearish configuration and MACD lines are tracking lower. All of these have further downside potential and suggest that rallies are now a chance to sell. The downside break leaves 72.40/72.90 as a sell-zone whilst 73.30 is left as a key lower high. This morning’s technical rally has helped to unwind the hourly RSI back into 50/60 area where the bulls have struggled recently and looks to be an opportunity. We are eyeing a bull failure between 72.40/72.70 and a move back to test the initial support of yesterday’s low at 72.05 before 70.00/71.00.
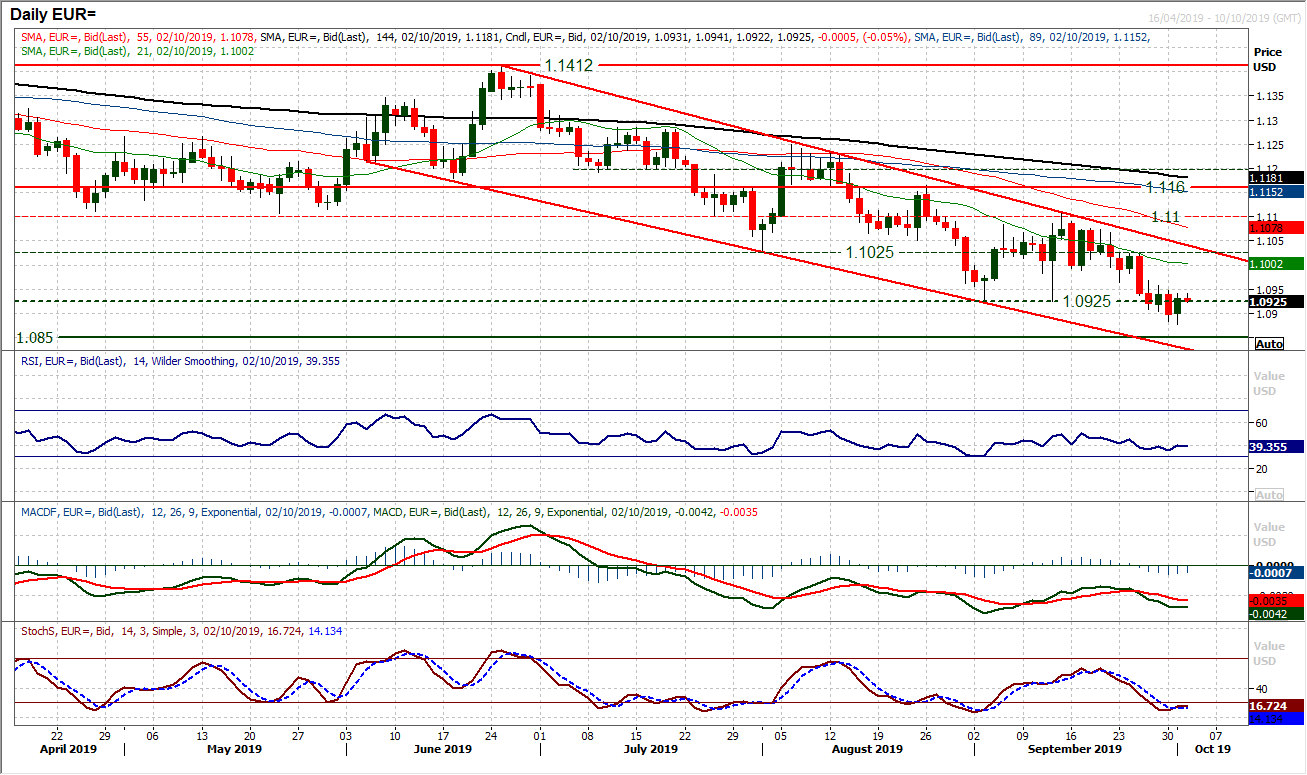
Within the context of this ongoing downtrend channel, we continue to view technical rallies on EUR/USD as a chance to sell. The positive candle from yesterday’s session has lifted the market from $1.0877 but simply provides another opportunity for the sellers. Daily momentum signals remain negatively configured on a medium term basis, whilst the hourly chart shows that this is not a recovery that the bulls should be getting overly excited about. There is plenty of overhead supply between $1.0960/$1.0990 to suggest that this will be a struggle for the bulls to gain any traction in a rebound. Whilst there is still room for a technical rally to pull the market higher, there is a lack of follow through this morning which suggest that the market will struggle to put together a run of positive candles on the daily chart. There have not been more than two positive candles in succession for two months. We continue to expect further pressure back on $1.0877 before $1.0850 is tested.
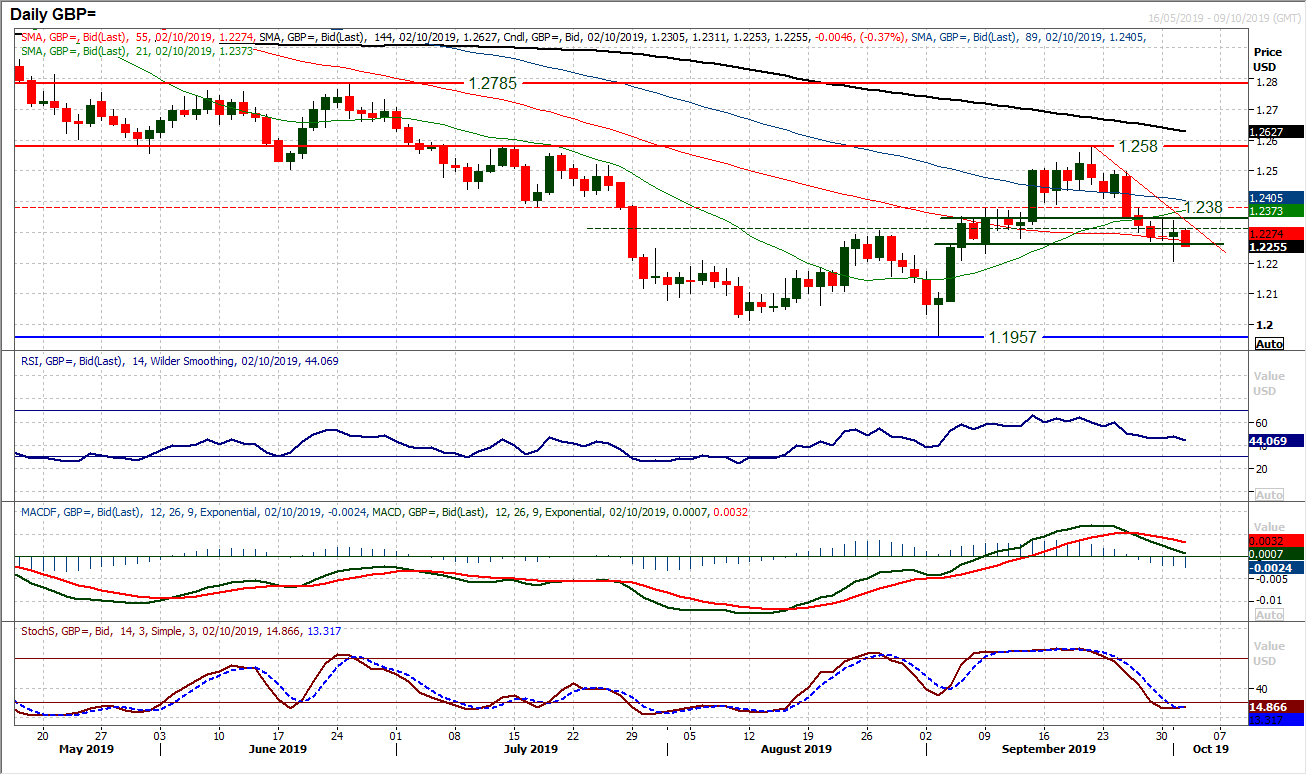
Cable rebounded yesterday as the dollar slipped back. However, the small body of the candlestick with a failure off the highs into the close, suggests a lack of follow through on this move. We have discussed the support around $1.2260/$1.2345 (around the neckline of the old base pattern), but it seems that this is now becoming restrictive to recovery as much as anything. Given that momentum indicators are still with the negative bias, the rebound from yesterday’s low at $1.2205 actually looks more like a chance to sell. There is a near term downtrend formation of the past eight sessions that is restrictive today and the hourly chart shows the unwind has helped to renew downside potential. The hourly RSI has again failed around 60 and MACD lines are failing around neutral. A move back under $1.2260 (previously lows this week) would suggest the sellers gaining momentum again.
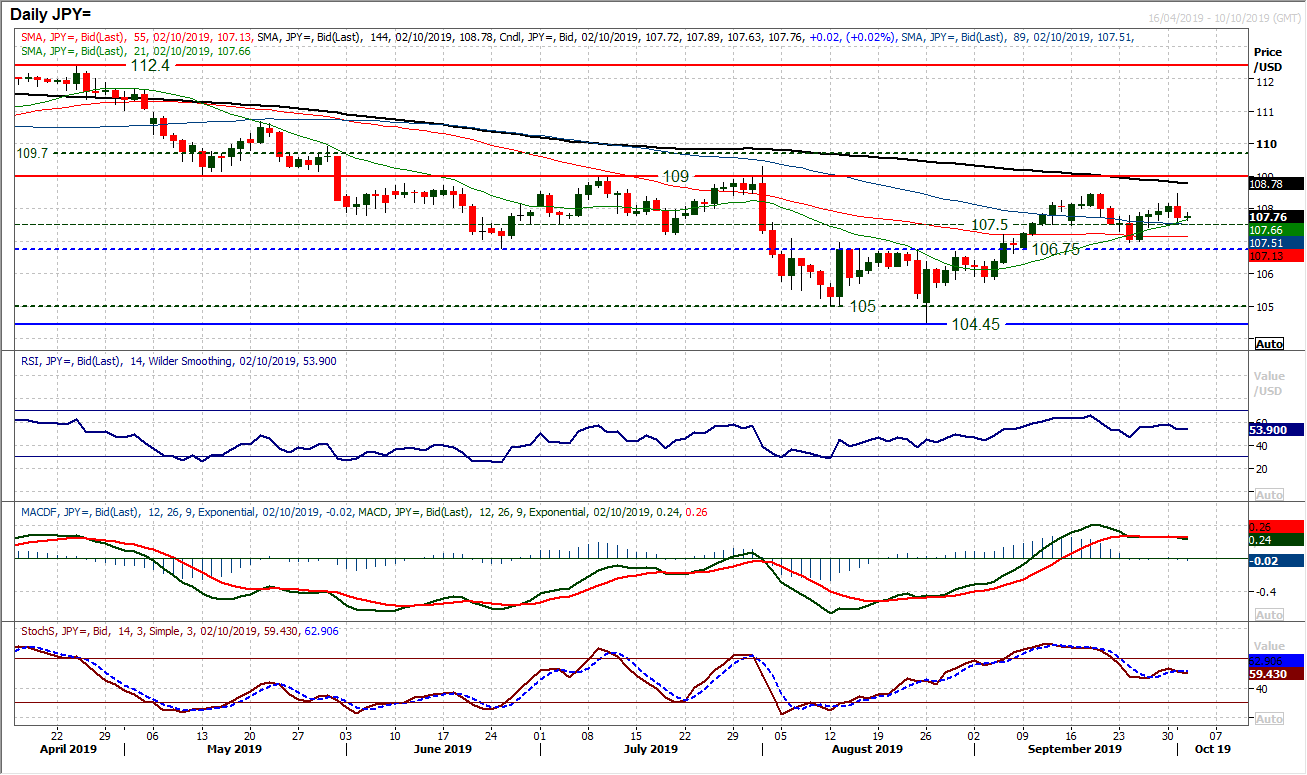
The dollar rally has been stopped in its tracks as the market took umbrage with the weak ISM data and traders have taken refuge in the yen safe haven. The question is whether this is an outlook changing move. Resistance at 108.47 from the September high has been hit pretty much to the pip as the market reversed. How the market reacts today to the bear reversal in yesterday’s session will be key for the near term outlook. A follow up negative candle would begin to drive momentum into a correction and then re-open the 106.95 recent key low. Indicators are fairly neutrally configured now, with RSI, MACD and Stochastics all flattening. There has been a decent reaction this morning from the bulls, whilst leaving support at 107.60. A failure of the higher low at 107.40 would open 106.95 again, however, for now the near term outlook is in the balance again.
Gold
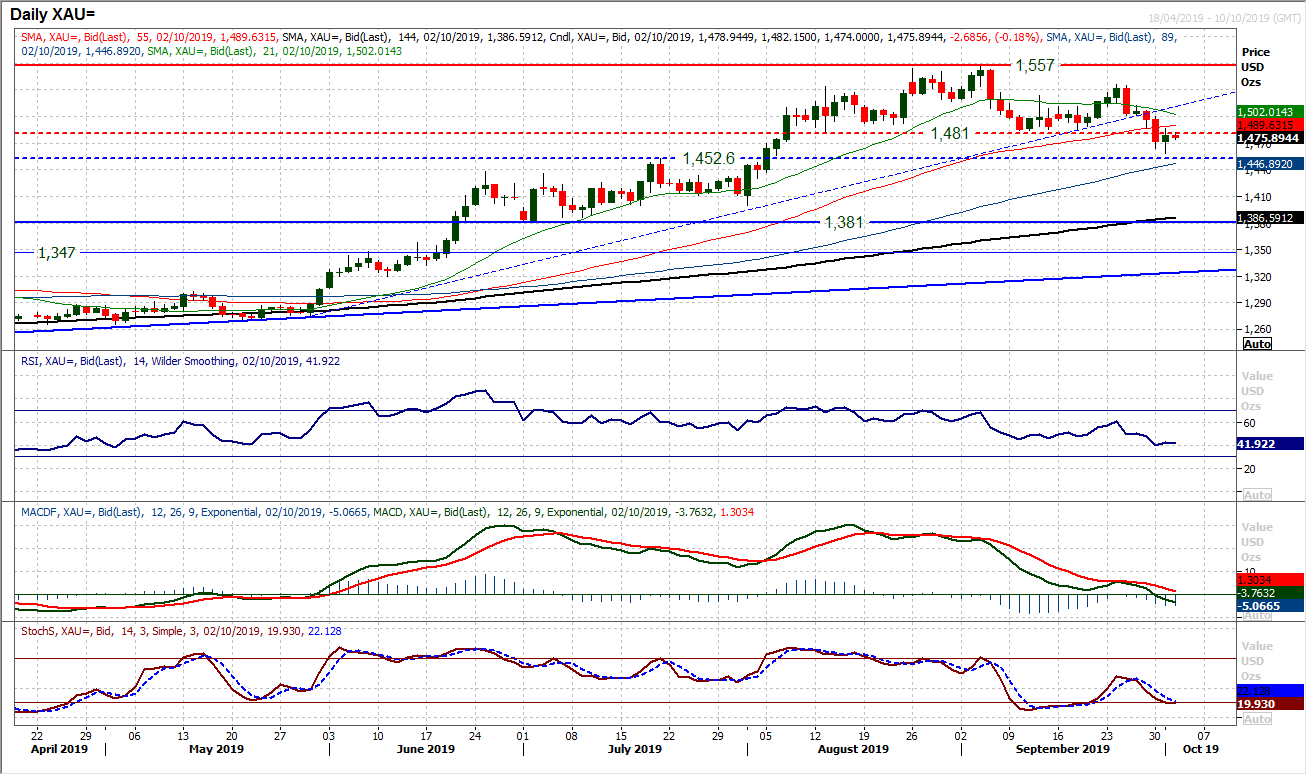
A huge one day turnaround on the ISM data has given the bulls hope of an instant recovery on gold. However, essentially the big top pattern is still the dominant feature of the medium term outlook and near term gains look likely to struggle. How the bulls respond to this rebound now will be key in the coming days. The neckline resistance between $1481/$1484 is a source of overhead supply. The initial bounce from yesterday’s low at $1458 added almost $30 before rolling over at $1487 and drifting back lower again. A close back under the neckline at $1481 today was disappointing for the bulls and another close below the neckline today would add to the ongoing corrective outlook. Given the continues deterioration in the medium term momentum configuration, this rally needs to be treated with caution. There are plenty of technical reasons for seeing rallies as a chance to sell again now. Any lower high between $1481/$1500 will be seen as a sell trigger, given the medium term negative corrective configuration now on momentum. The hourly chart shows a failure of a near term pivot at $1475 re-opens a test of $1458.
WTI Oil
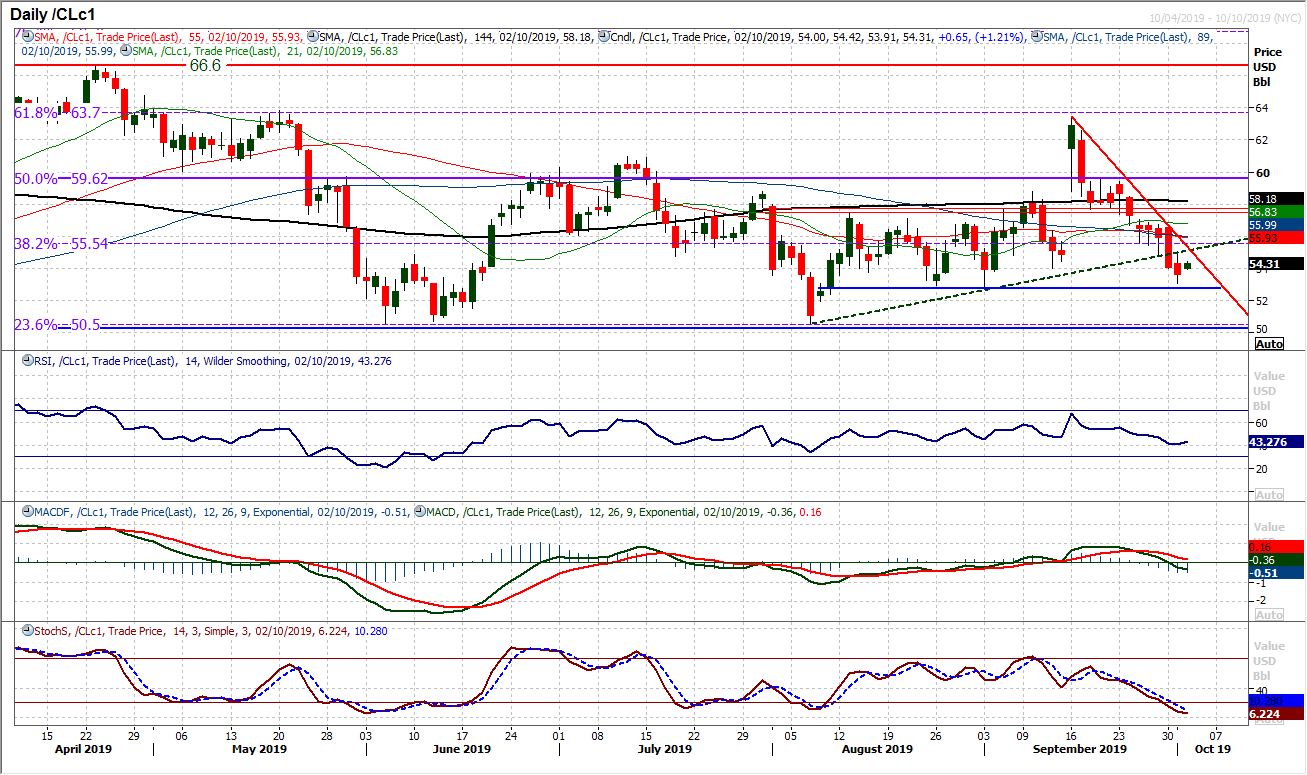
Rallies are a chance to sell. The sheer weight of the negative candles of the past three weeks leaves a growing corrective configuration on momentum indicators and that the bulls are struggling. A downtrend of the sharp pull lower of the past two weeks comes in at $55.30 today and is a confluence of what can also be seen as an old uptrend. With moving averages all now turning lower the 38.2% Fibonacci retracement at $55.55 is an area of resistance now. Expect continued pressure on the $52.85/$54.00 support area. A closing breach of $52.85 would be the next crucial breakdown.
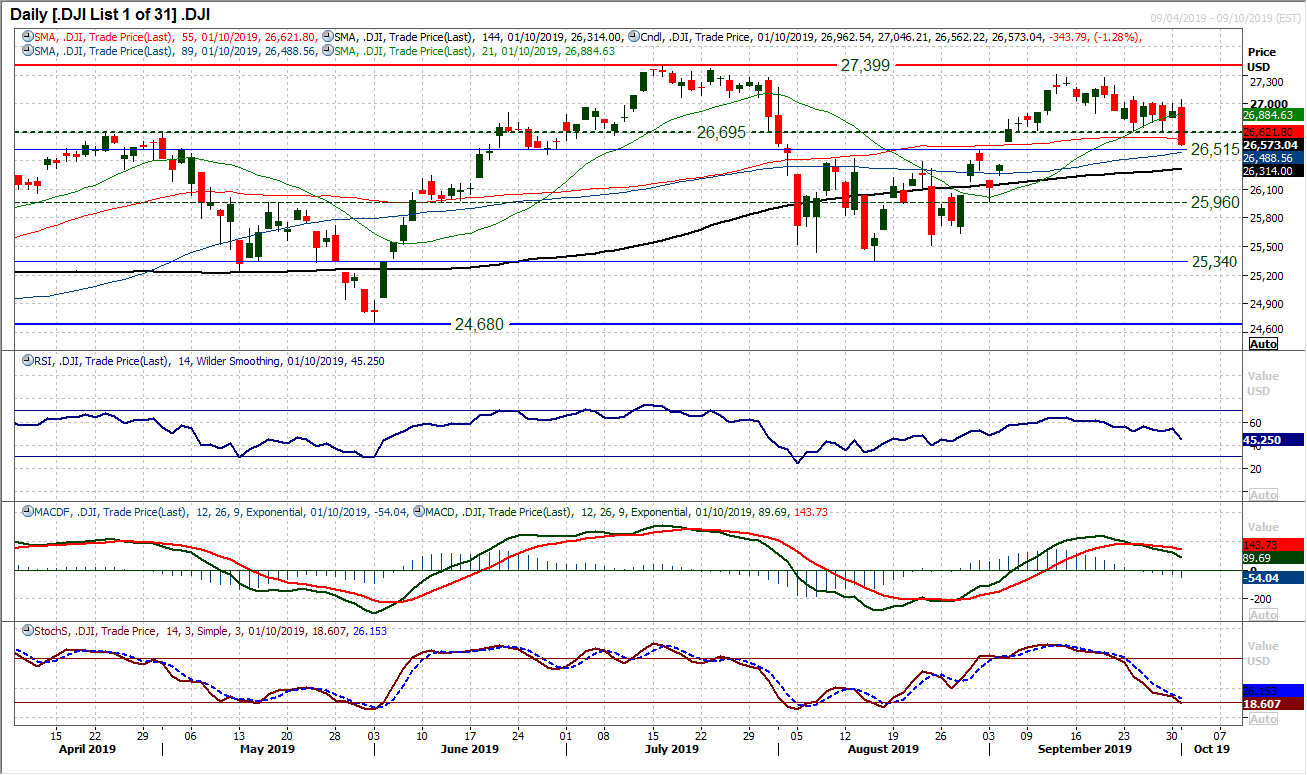
The corrective slide gathered momentum once again yesterday in the wake of the US ISM disappointment. A run of consolidation has been ended by a decisive negative candlestick in a move which brings the market to test a key band of support. The breakout band 26,515/26,695 is a key gauge and a breach of 26,515 would suggest a deeper correction is coming. A relatively sedate outlook on momentum has been replaced by one which looks increasingly corrective now. The RSI is falling at five week lows under 50, whilst MACD lines are accelerating lower along with Stochastics. The breakdown has left a growing resistance band 27,045/27,080 which is also adding to the growing run of lower highs. A close below 26,515 opens 25,960 as the next basis of support. Furthermore, any initial technical rally towards 26,700 will encounter overhead supply now and this is a first area of resistance.
"""DISCLAIMER: This report does not constitute personal investment advice, nor does it take into account the individual financial circumstances or objectives of the clients who receive it. All information and research produced by Hantec Markets is intended to be general in nature; it does not constitute a recommendation or offer for the purchase or sale of any financial instrument, nor should it be construed as such.
All of the views or suggestions within this report are those solely and exclusively of the author, and accurately reflect his personal views about any and all of the subject instruments and are presented to the best of the author’s knowledge. Any person relying on this report to undertake trading does so entirely at his/her own risk and Hantec Markets does not accept any liability. """
