Market Overview
Dollar bulls are flexing their muscles once again. The trade weighted Dollar Index has broken higher to levels not seen since May 2017. Across major markets the strength of the dollar is really impacting. With EUR/USD breaking below $1.0900 (admittedly at 57% of the Dollar Index, the two are intrinsically linked), there is also an outlook changing decline on gold too. The interesting fact is that this is coming at a time where Treasury yields have been relatively stable. So with bond markets uncertain, yield differentials are not the driver for now. However, it seems that the outperformance of the US data continues to show the US economy as being the best of a bad bunch in this phase of the global slowdown. A period of quiet on the trade dispute front (due to China’s week of national holiday) could also be playing into this. This comes ahead of a raft of key data points in the coming days, culminating with Non-farm Payrolls on Friday. Today’s manufacturing PMIs are likely to drive some volatility, but the RBA decision today has painted the picture of another major economy where the US outperformance looks set to continue. The Reserve Bank of Australia cut rates by -25 basis points (a cut of -25bps to +0.75% was forecast) with RBA Governor Lowe focusing on slowing jobs growth and low inflation. The prospect is that the RBA may not be done yet, despite three cuts in five months. Even though the move was priced in and fully expected, the Aussie has fallen further on the news. This just adds to the position of relative strength for the US dollar this morning.
Wall Street closed with decent gains as the S&P 500 was +0.5% at 2977, whilst US futures are another +0.4% in early moves today. In Asian, there was a positive bias, with the Nikkei +0.6% (China markets are closed for the national holiday still). Into the European session, there is a positive look to early moves, with FTSE futures +0.2% whilst DAX futures are +0.4%.
In forex, USD strength is again flexing across major markets, with AUD a key underperformance, whilst NZD is also weaker.
In commodities, the breakdown in gold is continuing today with about -0.6% (-$9) whilst oil is looking to find its feet again after yet another negative session yesterday.
The first trading day of the month is a day for Manufacturing PMIs on the economic calendar. The final Eurozone Manufacturing PMI for September is at 0900BST, which is expected to be unchanged at 45.6 (45.6 flash September, 47.0 final August).
The UK Manufacturing PMI is at 0930BST and is expected to slip further to 47.0 in September (from 47.4 in August). Final Eurozone inflation for September is at 1000BST which is expected to see headline HICP unrevised from the flash at +1.0% (+1.0% flash Sept, +1.0% final August). However, it is expected that the core HICP is set to be revised mildly higher to +1.0% (from +0.9% flash, +0.9% final August).
The US ISM Manufacturing is at 1500BST and is expected to move marginally back into (very tepid) expansion with 50.1 (up from 49.1 in August).
There are a whole raft of FOMC speakers in the coming days and today there are four to look out for. First up is the Chicago Fed President Charles Evans (voter, mild dove) at 0815BST. Then we have vice FOMC chair Richard Clarida (voter, mild dove) at 1350BST. The Fed’s arch-dove (and recent dissenter) James Bullard (voter, very dovish) is speaking at 1415BST, whilst finally, from the Board of Governors, Michelle Bowman (voter, mild hawk) is at 1430BST.
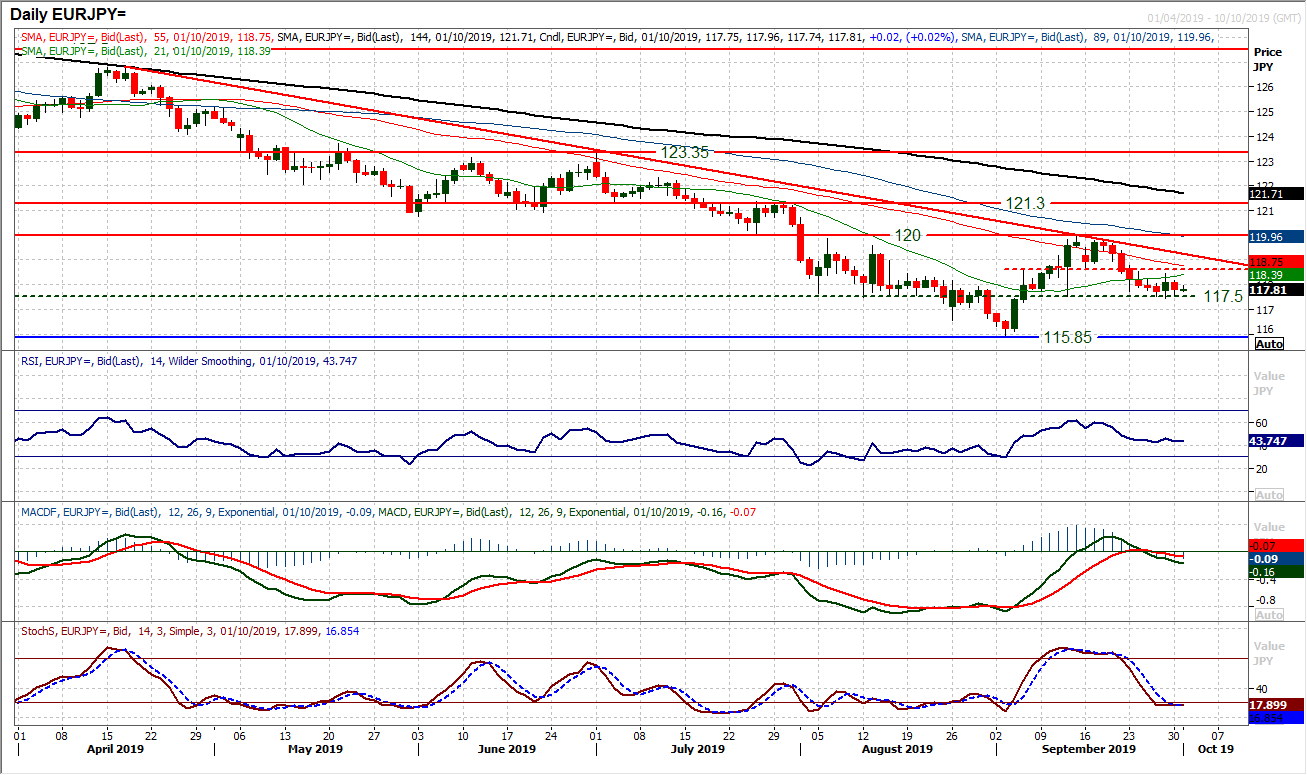
Chart of the Day – EUR/JPY
The outlook for Euro/Yen has been negative since a big downtrend kicked off back in April. A succession of lower highs and lower lows has formed to suggest that rallies are a chance to sell, a strategy backed by negatively configured medium term momentum. The market recently retreated once more from the 5 month downtrend and is setting up for a test of key near term support, below which would open the key multi-year low again. Support at 117.50 has held for a few weeks but the pressure is building again. Another rally on Friday was sold into to form another bear candle yesterday. Momentum confirms the negative bias, with the Stochastics set up in bearish configuration, whilst the MACD lines continue to track lower following a bear cross last week. The hourly chart is a little more of a ranging outlook but there still seems to be broad pressure on 117.50. An initial breach of 117.50 would imply a near term target of -100 pips, whilst a move back to the key low at 115.85 would be likely in due course. Resistance at 118.20/118.50.
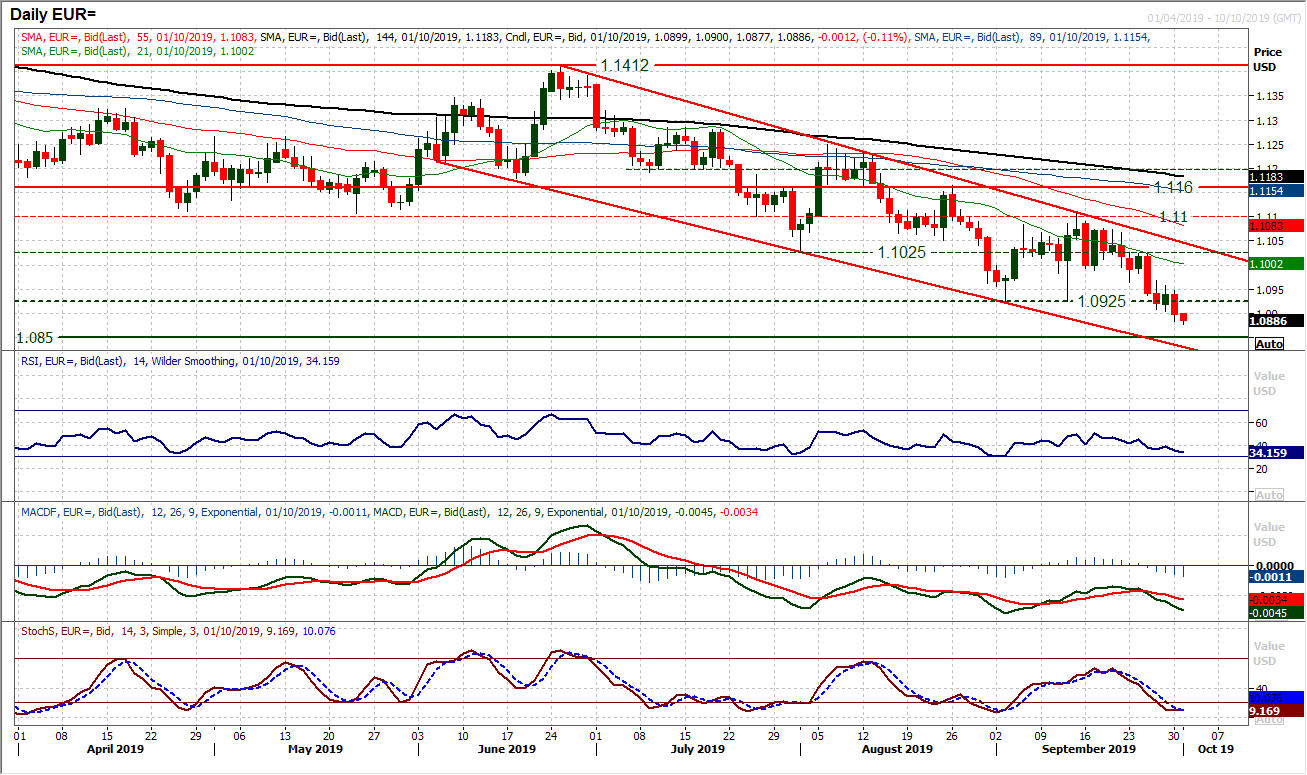
The euro is under pressure. The market has been trading around the old support at $1.0925 in recent sessions, but yesterday’s closing breach was decisive. Coming with a strong bear candle and a breach of $1.0900 too, the outlook continues to deteriorate. Having moves to the lowest since May 2017 the next support is $1.0850, whilst the bottom of the downtrend channel comes in at $1.0830 today. Momentum indicators are certainly reflective of this, with the RSI falling to the mid-30s with downside potential, whilst MACD lines and Stochastics also deteriorate. Intraday rallies are a chance to sell. The hourly chart shows that the market may be slightly stretched to the downside initially this morning, but any unwinding move into $1.0925 area is a chance to sell. Given the resistance that has formed with a succession of lower highs, the importance of $1.0965 as a key lower high is growing on the hourly chart.
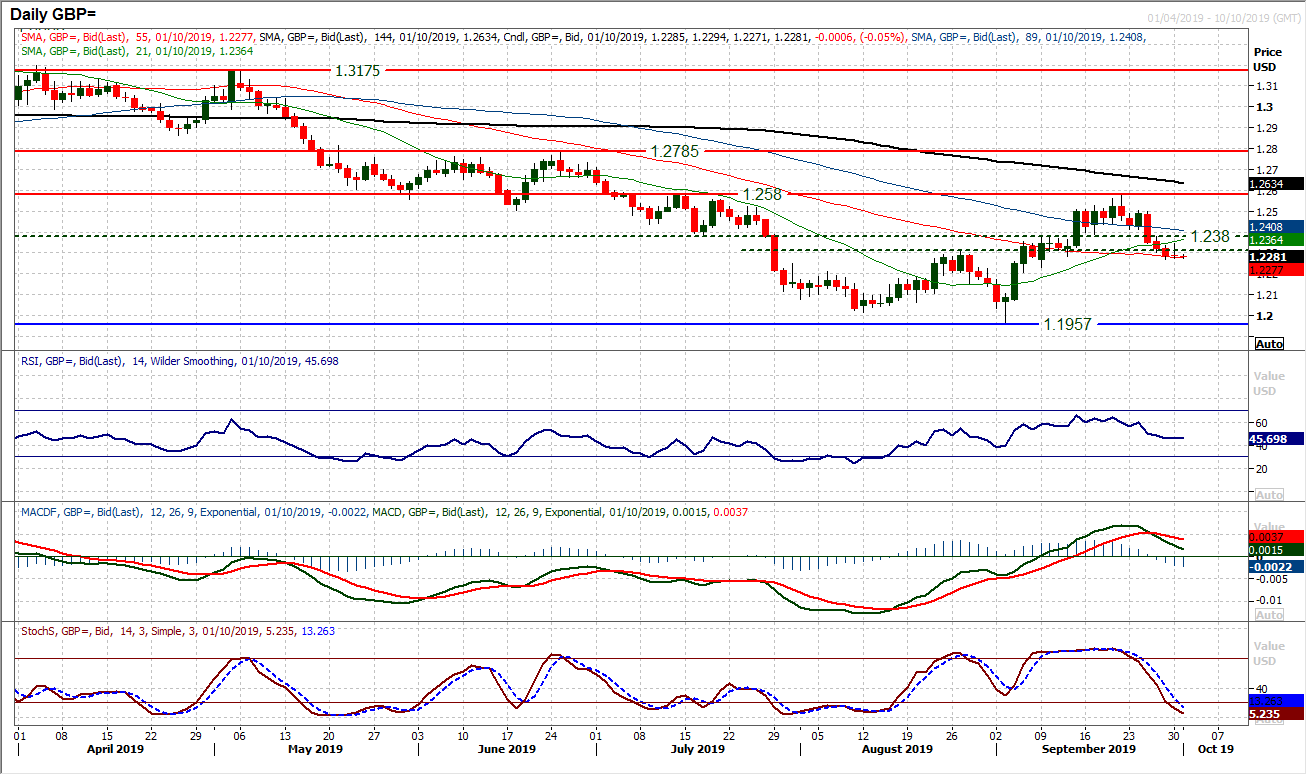
Cable held up relatively well yesterday in the face of renewed dollar strength. However, the one day candlestick formation reflects a market that continues to sell sterling into strength. A “gravestone doji” (long upper shadow but open and close at the same point near the day low) is a more powerful negative candle in an uptrend, but still suggests the bulls are not in a position of strength. However, if this were to be followed by a positive candle today, it would pose a few more positive questions. For now though, the market remains in a negative drift lower mode and is effectively testing a key area of support between $1.2280/$1.2305. The daily momentum is still corrective with the MACD and Stochastics still in decline. A decisive corrective outlook to take hold the market needs a closing breach of $1.2280. Initial resistance at $1.2345 from yesterday’s failed rebound. Below $1.2270 (yesterday’s low) opens $1.2230 and then a deeper correction.
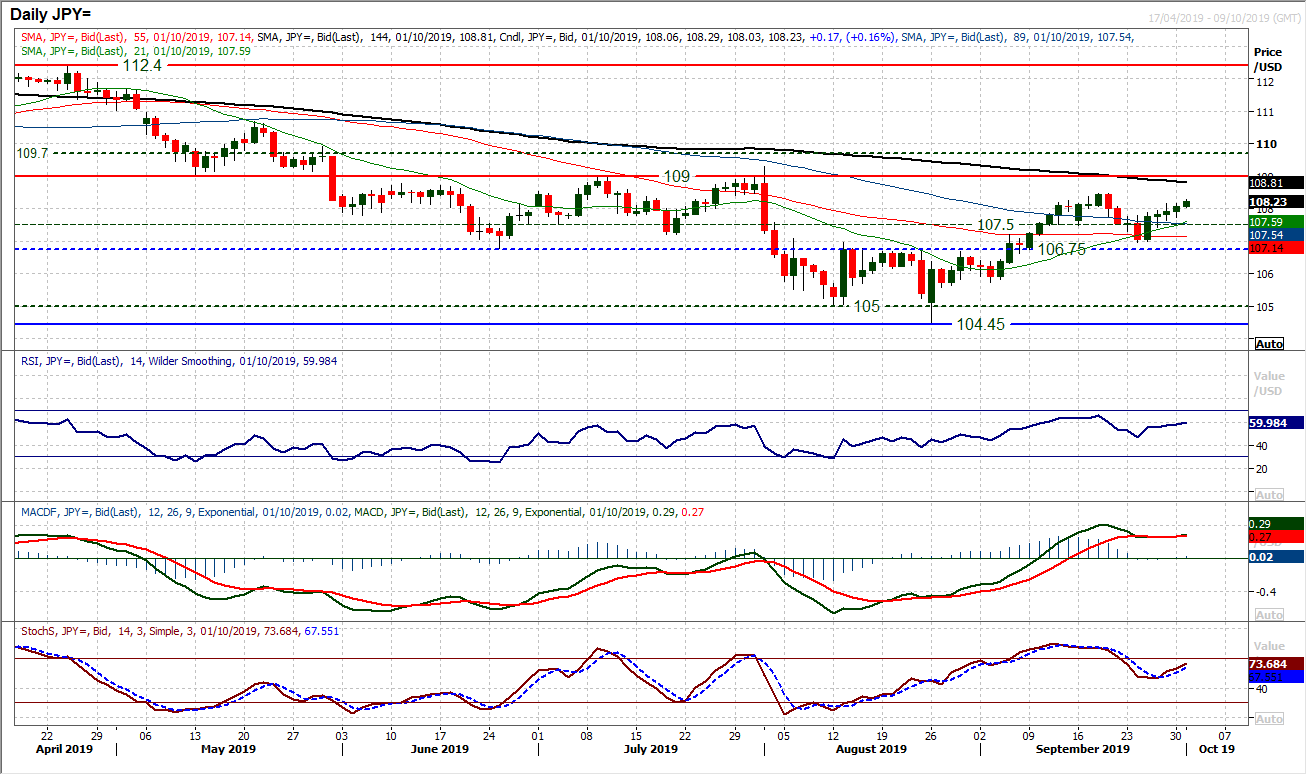
The dollar has been performing well of late, but it is interesting to see just drifting gains against the Japanese yen. Small bodied candlesticks and momentum indicators that are struggling for traction (albeit in positive configuration). This suggests a market still in recovery, but where the bulls lack a degree of conviction. Despite this, the market is still positive above the rising 21 day moving average (c. 107.60) and is holding above the 107.50 old pivot. This helps to build a broadening outlook of improvement. The key near term test is still the September high of 108.45, whilst the medium term pivot at 109.00 is looking overhead too. Support at 106.95 is increasingly important, coming above the 106.75 neckline support.
Gold
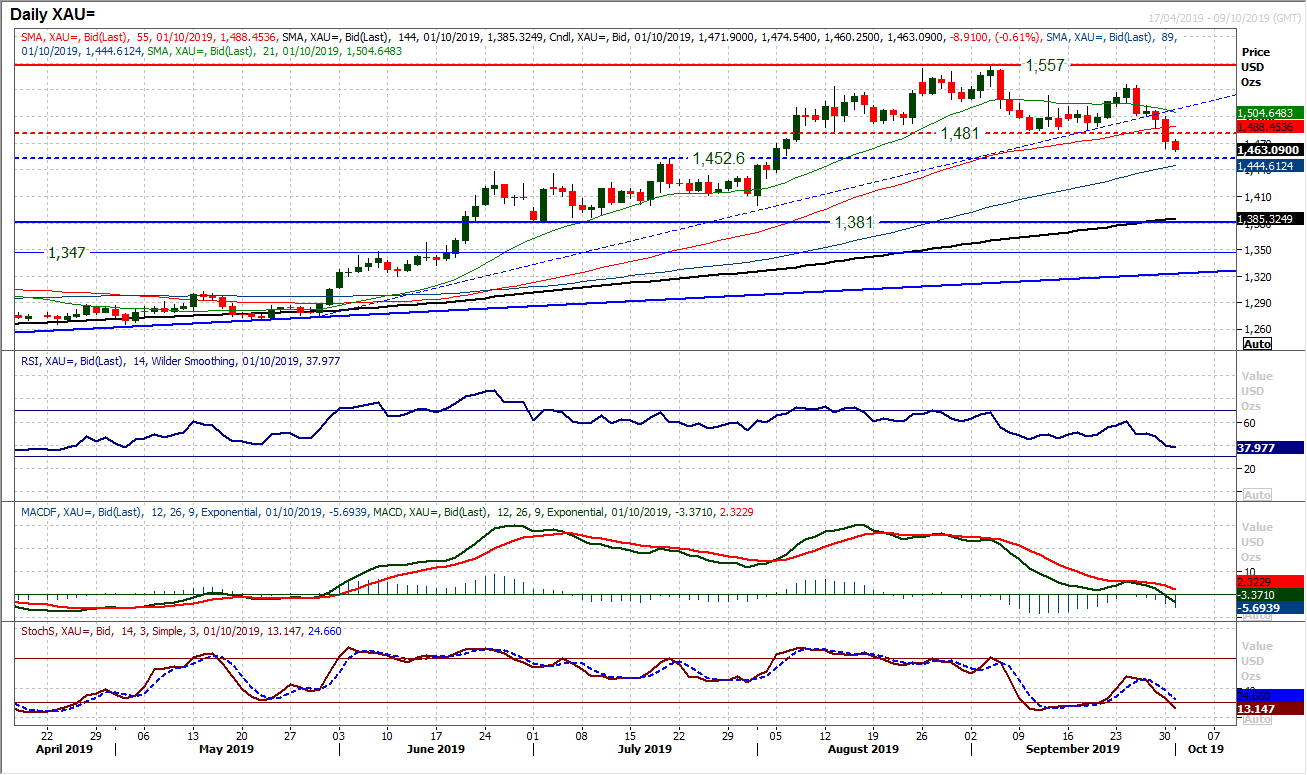
Gold has broken down. For the past few weeks, there has been a succession of faltering positive technical indicators. However, now with the price breaking so decisively below support at $1481, this is the key move. A head and shoulders top pattern implying $76 of downside target (to $1405) has completed. This comes with confirmation on MACD lines (falling below neutral), RSI below 40 and Stochastics negative. The move suggests that near term rallies are a chance to sell now. Initial support is at $1452 whilst there is a support band between $1400/$1452 which will come under scrutiny. The neckline at $1481 is resistance for a pullback rally as gold is now a sell into strength. The hourly chart shows minor resistance at $1475.
WTI Oil
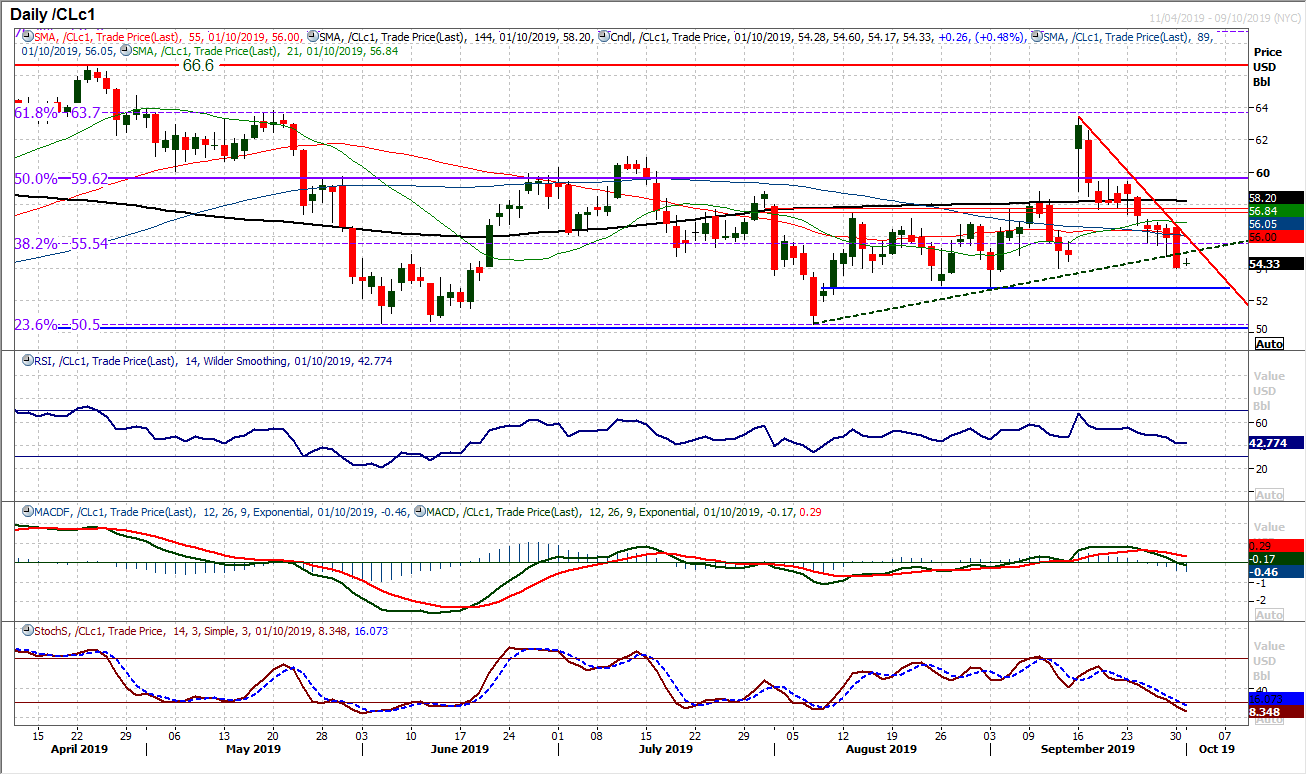
The corrective retracement on oil has entirely played out and the outlook is increasingly negative once more. The bullish spike higher gap from a couple of weeks ago has been decisively closed and momentum is increasingly negative. A test of the key support band between $52.85/$54.00 is now underway. Rallies are a chance to sell, with the 38.2% Fibonacci retracement at $55.55 now a basis of resistance overhead. The sellers are in control whilst resistance around $56.75 remains intact. The hourly char shows any unwinding move towards 50/60 on hourly RSI or around neutral on MACD is a chance to sell.
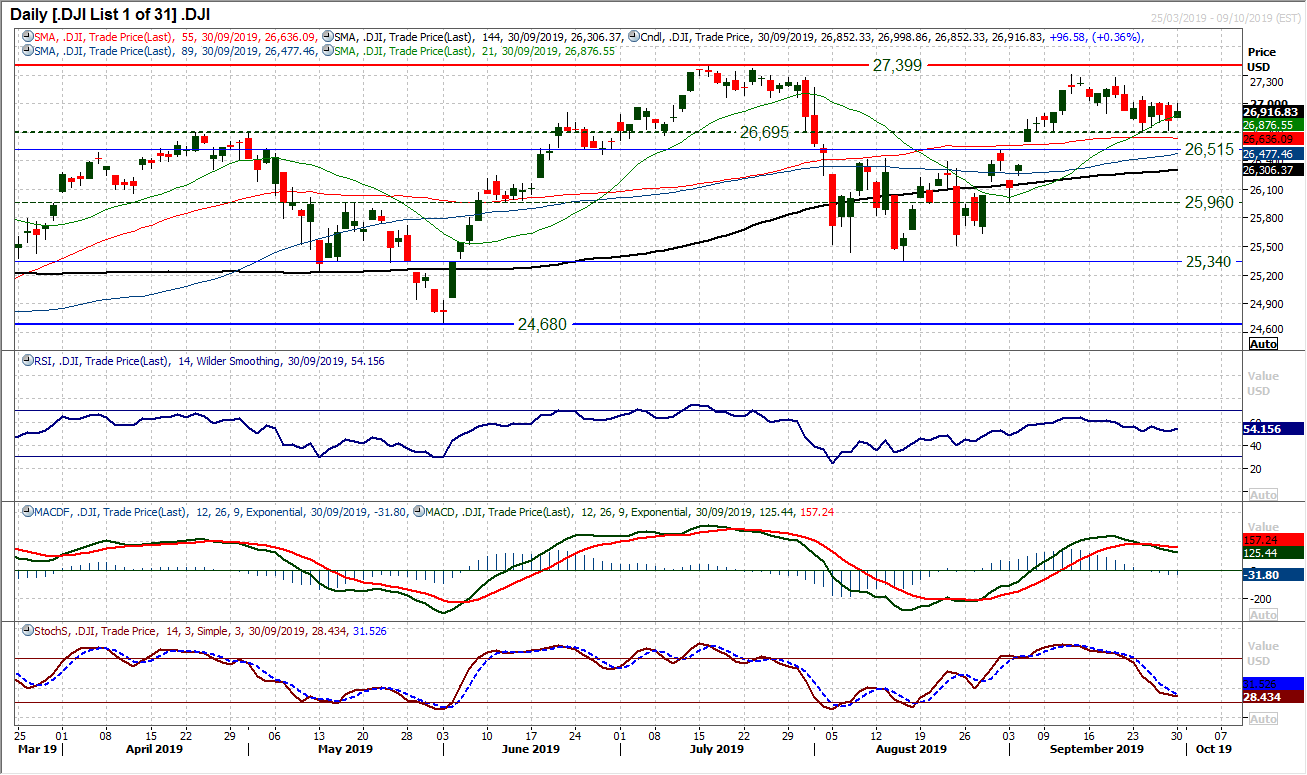
There is still a lack of direction on the Dow as the market continues to trade within the 1% trading range of the past six sessions. A mild tick higher on the day, but well off the highs of the session helps to bolster the resistance overhead between 72,015/27,080. Momentum indicators have been cut adrift in recent sessions, but there is still a marginal positive bias on the medium term configuration (RSI above 50, MACD lines settles above neutral) which will still encourage the bulls. The bulls will be content during this phase of trading as the market holds above the medium term support band 26,515/26,695 and the selling pressure that could have built up over the past couple of weeks has failed to materialise. A period of quiet may take more direction in the coming days with a raft of Fed speakers and tier one data due. For now though the 1% mini range between 26,705/27,080 continues.
"""DISCLAIMER: This report does not constitute personal investment advice, nor does it take into account the individual financial circumstances or objectives of the clients who receive it. All information and research produced by Hantec Markets is intended to be general in nature; it does not constitute a recommendation or offer for the purchase or sale of any financial instrument, nor should it be construed as such.
All of the views or suggestions within this report are those solely and exclusively of the author, and accurately reflect his personal views about any and all of the subject instruments and are presented to the best of the author’s knowledge. Any person relying on this report to undertake trading does so entirely at his/her own risk and Hantec Markets does not accept any liability. """
