
- All Instrument Types
- Indices
- Equities
- ETFs
- Funds
- Commodities
- Currencies
- Crypto
- Bonds
- Certificates
Please try another search

FTSE Looks For A Leg-Up | SGRO, AVV, JD

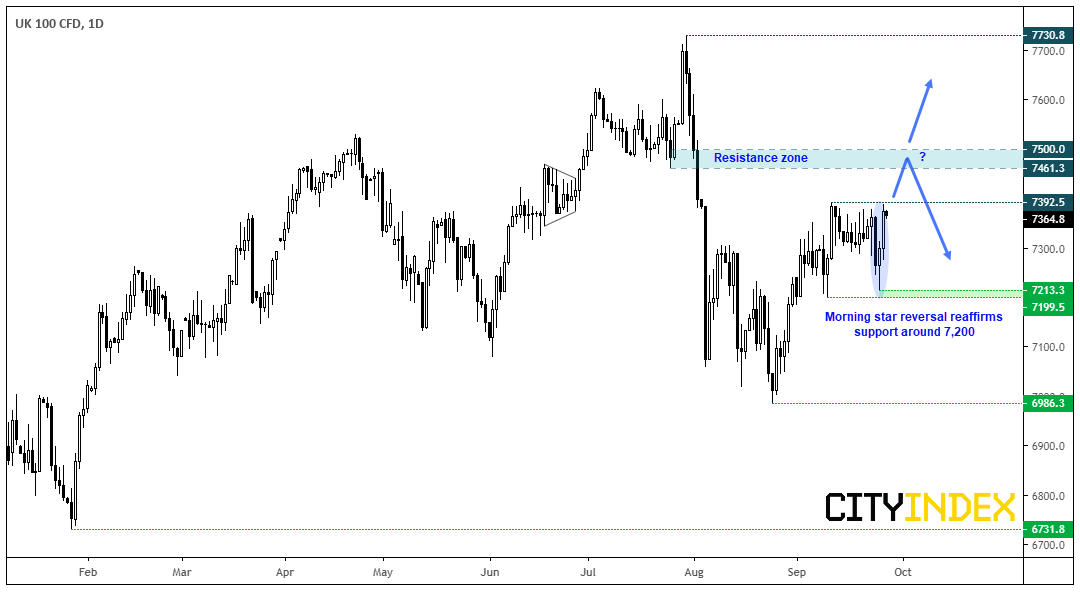
The FTSE 100 has lagged its US and European counterparts this year, but that doesn’t mean it doesn’t try to play catch-up. We noted that US indices had respected key support levels along with USD/JPY, which paints a glimmer of hope we could be headed for a bout of risk-on. If so, it could provide the FTSE100 with a much-needed tailwind and help it break to a new cycle high.
We can see on the daily chart that yesterday’s bullish candle closed just off the highs of a 3-week range. Moreover, Wednesday’s low reaffirmed support around 7,200 before heading higher and is part of a 3-bar bullish reversal pattern at support (the morning star reversal). From here’s we’re looking for a break above 7,392.50 to confirm a breakout, although we’re also mindful that interim resistance awaits around 7,461.30 so this should be taken into account for from a reward/risk perspective.
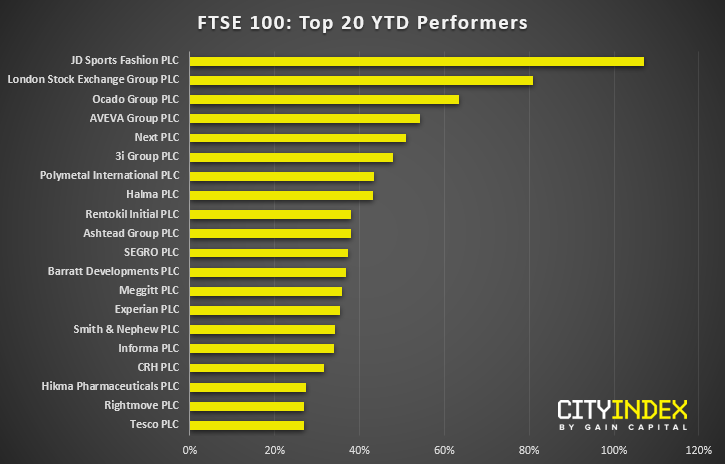
With that said, there’ll still be some stocks within the index which may sustain a better breakout, so we’ve listed the top 20 performers YTD (year to date) and selected three FTSE stocks worth following.
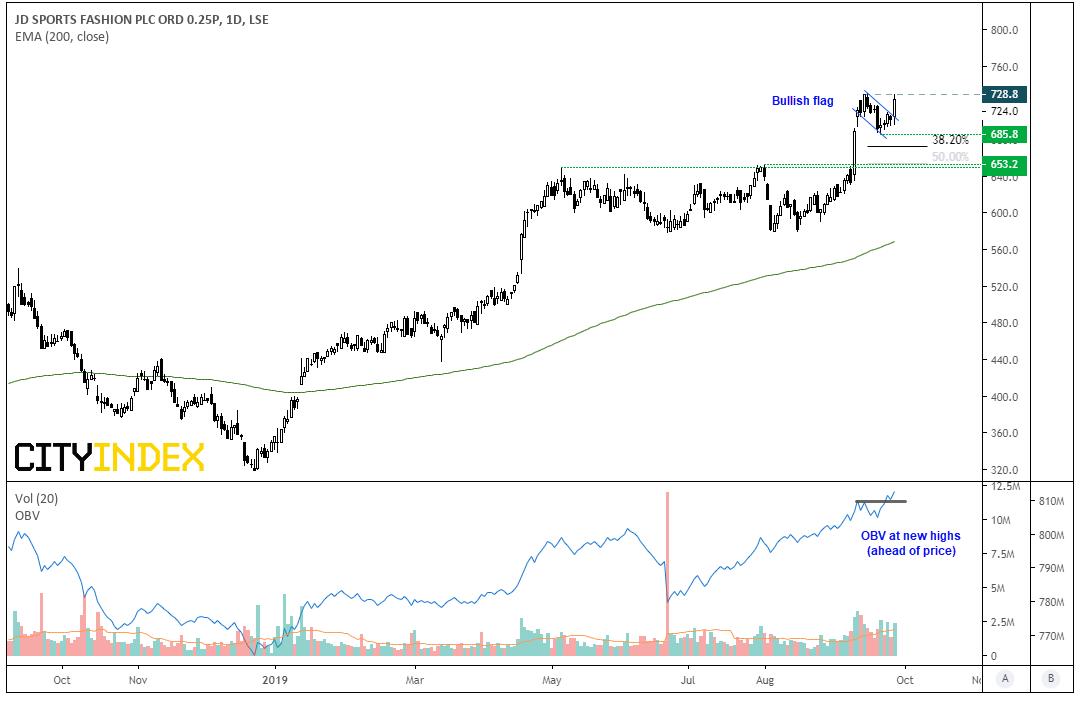
JD Sports (JD) sits just off record highs following yesterday’s range expansion day. That the pullback failed even to test the 38.2% retracement is a testament to the trend’s strength, and momentum has only increased since breaking out of its basing pattern on the 10th September. The retracement took the form of a small bullish flag which is a continuation pattern in an uptrend. Furthermore, as daily volumes remain above average and OBV is at fresh highs ahead of price are encouraging signs for a bullish breakout.
- Bulls could take a break above 730 as a sign the trend is set to resume
- The bias remains bullish whilst prices hold above the 653.2 breakout level, which could allow traders to buy dips above support if prices fail to break/hold higher
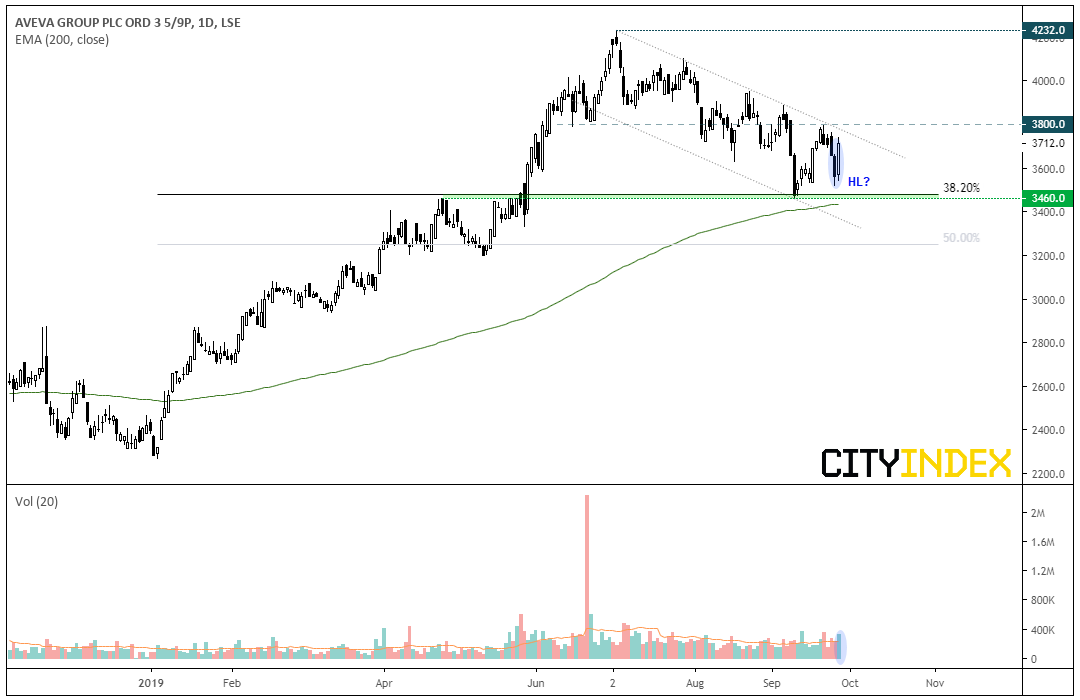
AVEVA Group (AVV) is currently trading within a bearish channel, although there are signs that it could be building up for a break higher to resume its longer-term bullish trend. The September low found support at the April high around 3460, which is near the 38.2% Fibonacci retracement level and above the 200-day EMA.
Yesterday’s 2-bar reversal marks a potential higher low, so a base could now be forming ahead of a bullish breakout. Volume was also above average yesterday, which is an encouraging sign for a break higher.
- Bulls could use a break above 3,800 to signal a bullish breakout from the corrective channel. However, we’d prefer to see any breakout be accompanied on higher than average volume and/or OBV breaking a cycle high.
- Bears could seek short setups if the channel caps as resistance on lower timeframes. The 3460 lows become the next target, although a break beneath here and the 200-day EMA suggests we’re in for a deeper correction on the daily timeframe.
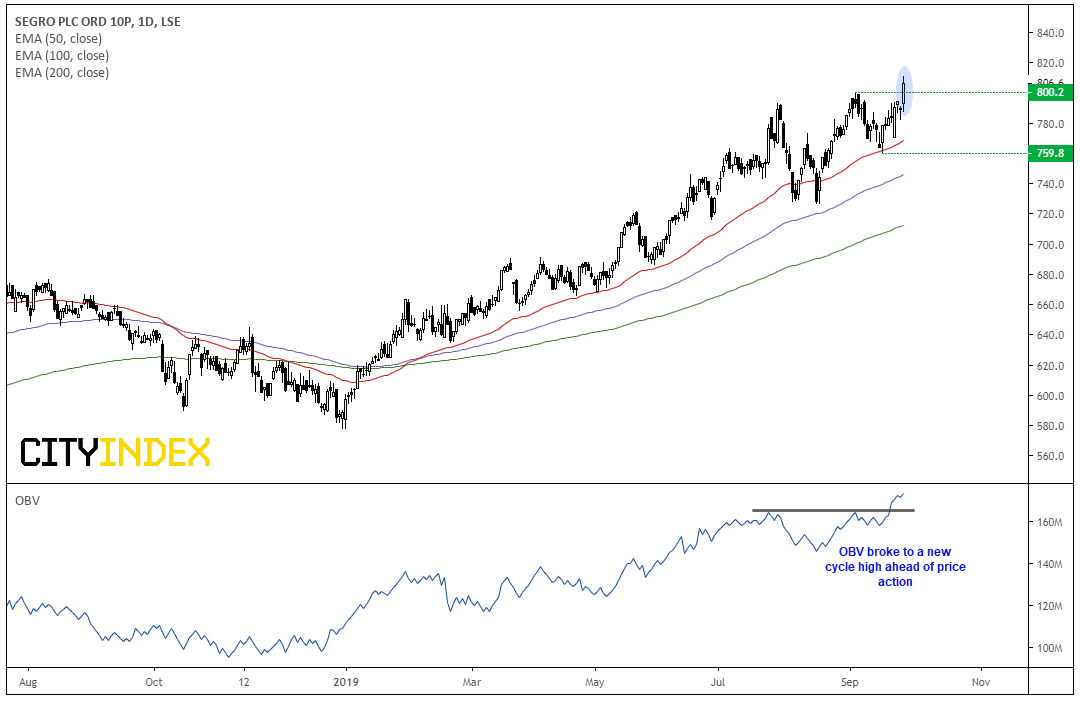
Segro Group (SGRO) trades in a clearly defined uptrend, and the moving average is within the bullish sequence and all pointing higher, to show momentum across multiple timeframes is bullish. Yesterday the stock broke and closed to a new cycle high above 800. Moreover, OBV (on balance volume) broke higher ahead of the breakout to show bullish demand was picking up.
- The trend remains bullish above 759.8, so bulls could seek to buy dips above this structural level and keep an open, bullish target
- Intraday traders could see of 800 holds as support to consider long positions
- The bullish bias is invalidated with a break beneath the 759.8 low.
"Disclaimer: The information and opinions in this report are for general information use only and are not intended as an offer or solicitation with respect to the purchase or sale of any currency or CFD contract. All opinions and information contained in this report are subject to change without notice. This report has been prepared without regard to the specific investment objectives, financial situation, and needs of any particular recipient.
Any references to historical price movements or levels are informational based on our analysis, and we do not represent or warrant that any such movements or levels are likely to reoccur in the future. While the information contained herein was obtained from sources believed to be reliable, the author does not guarantee its accuracy or completeness, nor does the author assume any liability for any direct, indirect or consequential loss that may result from the reliance by any person upon any such information or opinions."
Related Articles

Recent headlines appear to have shaken investor sentiment. It’s premature to read too much into a few days of weaker-than-expected survey numbers. More importantly, the latest...

UK markets were off to a brisk start amid the technological navel gazing elsewhere. The medical sector received another shot in the arm following strong numbers from FTSE100...

The stock market sold off on a decline in February's Consumer Confidence Index (CCI), confirming a similar decline in February's Consumer Sentiment Index (CSI), which was reported...
Are you sure you want to block %USER_NAME%?
By doing so, you and %USER_NAME% will not be able to see any of each other's Investing.com's posts.
%USER_NAME% was successfully added to your Block List
Since you’ve just unblocked this person, you must wait 48 hours before renewing the block.
I feel that this comment is:
Thank You!
Your report has been sent to our moderators for review



Add a Comment
We encourage you to use comments to engage with users, share your perspective and ask questions of authors and each other. However, in order to maintain the high level of discourse we’ve all come to value and expect, please keep the following criteria in mind:
Perpetrators of spam or abuse will be deleted from the site and prohibited from future registration at Investing.com’s discretion.