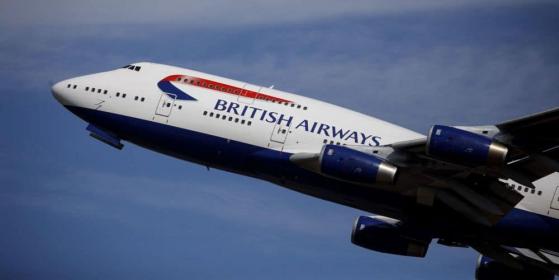
IAG (LON: IAG) share price is doing well as investors wait for the company’s financial results set for May 10th. It soared to a high of 181.20p on Monday, its highest swing since November 2021, making it one of the top-performing airline companies. It has jumped by almost 100% from its lowest point in 2022.
International Consolidating Airline earnings
This will be an important week for IAG, the parent company of British Airways (LON:ICAG) and Aer Lingus as it publishes its Q1 earnings report. These numbers will provide more information about its performance as the travel industry growth continues.
IAG and other airlines have done well because of the continuing recovery of the sector. Most airlines published strong financial results. Delta Air Lines (NYSE:DAL) said that its adjusted earnings rose by 45% to $380 million in Q1 as revenue soared to $12.6 billion.
American Airlines (NASDAQ:AAL) revenue came in at $12.57 billion while United Airlines’s revenue reported strong results. However, most US airlines reported weaker profits because of their exposure to Boeing (NYSE:BA), a company that is going through major headwinds.
While IAG has exposure to Boeing, it is a bit insulated because of its fleet. British Airways only has Boeing 777 and 787 in its fleet while Aer Lingus and Vueling have only Airbus planes.
IAG business has been doing well as evidenced by last year’s financial results. Its total revenue rose by 27% to 29.4 billion euros while its profit after tax jumped to 2.6 billion euros. Its total load factor has risen to almost 90%.
Analysts expect that IAG’s business did well in Q1 as flying costs reduced. The consensus median for its operating result is 49 million euros while its mean was 49 million euros. For the financial year, analysts expect that its result will jump to 3.5 billion.
Traders will be focusing on the company’s dividend policy as its profits remains elevated. The company did not pay a dividend last year as it worked to reduce its debt. It slashed its net debt from over 10 billion to 9.24 billion euros.
IAG share price forecast
IAG chart by TradingView
The daily chart shows that the IAG stock price has moved to a cruising altitude ahead of earnings. It has recently crossed the crucial resistance point at 173.20, its highest point in February and August 2023.
The stock has remained above the 50-day and 200-day Exponential Moving Averages (EMA), which is a positive sign. At the same time, the Relative Strength Index (RSI) and the Percentage Price Oscillator (PPO) have all pointed upwards.
Therefore, the outlook for the stock is bullish as long as it can remain above the key resistance at 179.75p. This is an important level since it is where the stock formed a double-top pattern. In most cases, this pattern is usually a popular bearish sign.
