Benzinga - by Surbhi Jain, .
Walmart Inc (NYSE:WMT) is set to report first-quarter earnings on Thursday. Wall Street expects 49 cents in EPS and $148.9 billion in revenues as the company reports before market hours.
Let’s look at what the charts indicate for the retail giant’s stock, and how it currently maps against Wall Street estimates.
Walmart Stock’s Near-Term Appears Bearish The stock is up 18.18% over the past year, 13.9% year-to-date. It’s currently exhibiting a moderately bearish trend with slight selling pressure.
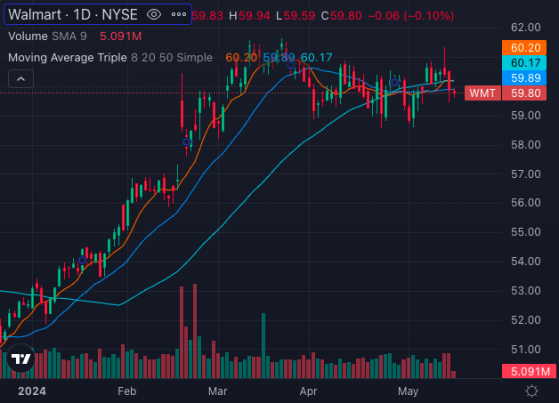
Chart: Benzinga Pro
The stock price stands at $59.80, which is below its eight-day simple moving average (SMA) of $60.20, signaling short-term bearishness.
Similarly, the 20-day SMA of $59.89 and the 50-day SMA of $60.17 reinforce the bearish indications, as both averages are higher than the current share price.
However, the stock price remains above the 200-day SMA of $55.49, which suggests long-term bullishness.
Chart: Benzinga Pro
The Moving Average Convergence Divergence (MACD) indicator for WMT is 0.08, indicating a bullishness, which contrasts with the short-term bearish signals from the SMAs.
Additionally, the Relative Strength Index (RSI) is at 48.38, suggesting the stock is neither overbought nor oversold. However, the trend appears to be a declining RSI, in which case a breach of the 30 mark could imply a potential reversal or stabilization in the near-term.
Further, we looked into the Bollinger Bands for support to the other technical oscillators. The stock is currently dribbling between the lower and upper bands — not giving out any clear signal.
Overall, while short-term indicators reflect a bearish trend for Walmart stock, longer-term signals and supplementary indicators like the MACD suggest bullish sentiments amid traders.
Also Read: How To Earn $500 A Month From Walmart Stock Ahead Of Q1 Earnings
Walmart Analysts Bullish – See 13%+ Upside Ratings & Consensus Estimates: The consensus analyst rating on Walmart stock stands at a Buy currently with a price target of $145.38.
Evercore ISI Group, Telsey Advisory Group, and UBS provided the most recent analyst ratings. Their reports, published May 7 onwards, have an average price target of $68 on the stock.
That’s an implied 13.66% upside for Walmart stock.
WMT Price Action: Walmart stock was trading at $59.83 at the time of publication.
Read Next: Walmart Q1 Earnings Preview: Analyst Estimates, ‘Everyday Low Price’ Model Resonates With Households Across Income Levels
Latest Ratings for WMT
| Feb 2022 | Morgan Stanley | Maintains | Overweight | |
| Feb 2022 | Raymond James | Maintains | Outperform | |
| Feb 2022 | Deutsche Bank | Maintains | Buy |
View the Latest Analyst Ratings
© 2024 Benzinga.com. Benzinga does not provide investment advice. All rights reserved.
Read the original article on Benzinga
