Benzinga - by Melanie Schaffer, Benzinga Editor.
Direxion Daily Retail Bull 3X Shares (ARCA: RETL) was surging about 10% on Monday, partly driven by massive bullish momentum in GameStop Corporation (NYSE: GME) stock –the latter which was skyrocketing about 65% after Keith Gill resurfaced on social media.
Traders and investors may be choosing to take a position in RETL, which holds a 1.2% weighting of GameStop, as well as multiple other retail stocks, to take advantage of GameStop’s upward trajectory but with diversification.
RETL is a triple-leveraged fund that is designed to outperform the S&P Retail Select Industry Index 300%. The ETF tracks many stocks popular with retail traders, with Amazon.com, Inc (NASDAQ: AMZN), Target Corp (NYSE: TGT) and Walmart, Inc (NYSE: WMT) making up 3.07% of its holdings.
Read Next: Semiconductor Stocks Pop After Fed Meeting And Strong Numbers From This Chip-Maker
Trending: 'Republicans Smell Blood In The Water:' Uniswap CEO Warns Democrats Of 'Swing States Level Miscalculation' On Crypto
It should be noted that leveraged ETFs are meant to be used as a trading vehicle by experienced traders, as opposed to a long-term investment. Leveraged ETFs should never be used by an investor with a buy-and-hold strategy or those who have low-risk appetites.
Want direct analysis? Find me in the BZ Pro lounge! Click here for a free trial.
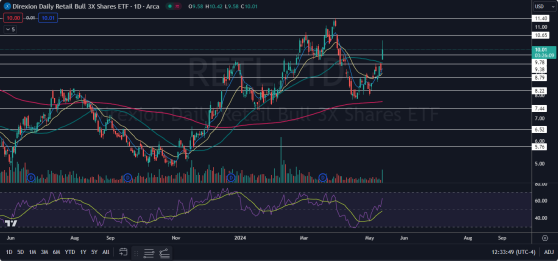
The RETL Chart: RETL gapped up above the 50-day simple moving average on Monday before topping out at $10.42, where the ETF began to pull back slightly. RETL’s surge also caused the eight-day exponential moving average (EMA) to move higher above the 21-day EMA, which is bullish.
- The upward movement confirmed the uptrend, which RETL has been trading in since April 16, remains intact. The most recent confirmed higher high within the uptrend was formed on May 7 at $9.40 and the most recent higher low was printed at the $8.59 mark the following day.
- If RETL closes Monday’s trading session under the $10 level, the ETF will print a shooting star candlestick, which could indicate the local top has occurred and RETL will fall on Tuesday. If the ETF closes the trading day near its high-of-day, it will print a bullish kicker candlestick, which could indicate higher prices are on the horizon.
- The move higher on Monday was taking place on higher-than-average volume, which indicates a high level of interest in the ETF. If RETL continues to trek north without sideways consolidation, the ETF will enter into overbought territory, which could signal at least a temporary pullback is in the cards.
- RETL has resistance above at $10.65 and at $11.40 and support below at $9.78 and at $9.38.
Read the original article on Benzinga
