Benzinga - by Melanie Schaffer, Benzinga Editor.
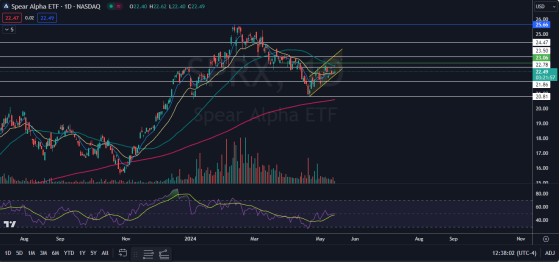
Spear Alpha ETF (NASDAQ: SPRX) was trading flat on Tuesday, continuing to trade sideways within a tight range between about $22 and $22.90 on decreasing volume.
The actively managed fund provides exposure to various stocks falling under the themes of enterprise digitalization, automation and robotics, artificial intelligence (AI), environmental focus and decarbonization, photonics and additive manufacturing and space exploration. While SPRX has been trading horizontally, several of its holdings are set to print quarterly financial results over the coming weeks, which could break the ETF from the sideways pattern.
Read Next: Is Ivana Delevska The New Cathie Wood? SPRX Performance Leaves ARKK In The Dust
Trending: GameStop's David Vs. Goliath Rematch: Shorts Face $1.4B Loss In 2024 As Roaring Kitty Returns
Snowflake, Inc (NYSE: SNOW), weighted at 7.36%, is set to print its earnings on May 22. On May 30, the top two holdings within SPRX, NVIDIA Corporation (NASDAQ: NVDA) and Zscsaler, Inc (NASDAQ: ZS), will print their quarterly financials. The stocks are weighted at 11.04% and 9.48%, respectively.
For investors, particularly those who believe in the power of diversification, SPRX holds many other popular stocks, including Advanced Micro Devices, Inc (NASDAQ: AMD), weighted at 8.36%, SentinelOne, Inc (NYSE: S), weighted at 6.02% and Shopify, Inc (NYSE: SHOP), weighted at 5.54%. While AMD and Shopify have already printed their earnings reports, SentinelOne will print its results on May 30.
Want direct analysis? Find me in the BZ Pro lounge! Click here for a free trial.
The SPRX Chart: SPRX has been trading sideways since May 3 but since April 22, the ETF has been trading in a rising channel pattern on the daily chart. The pattern is considered to be bullish until a stock or ETF breaks down from the lower ascending trend line of the formation on higher-than-average volume.
- On Tuesday, SPRX tested the lower trend line of the pattern and bounced up from the area to regain the eight-day and 21-day exponential moving averages, which is bullish for the short term. If SPRX continues to respect the rising channel pattern and moves north over the next few trading days, the ETF will regain the 50-day simple moving average, which would be bullish for the longer term.
- Bulls want to see bullish momentum continue, which is indicated by the rising relative strength index making a series of higher highs and higher lows. Bears want to see big bearish volume come in and knock SPRX down from the channel pattern, which could cause a longer-term downtrend to occur.
- SPRX has resistance above at $22.78 and at $23.50 and support below at $21.86 and at $20.81.
© 2024 Benzinga.com. Benzinga does not provide investment advice. All rights reserved.
Read the original article on Benzinga
