While the rally in some of the reopening stocks has fizzled out, the back to the office trade is alive and well.
This was first evidenced by earnings beat by Ulta Beauty Inc. (NASDAQ: NASDAQ:ULTA), which nudged the issue to an all-time high — impressive in today's market environment.
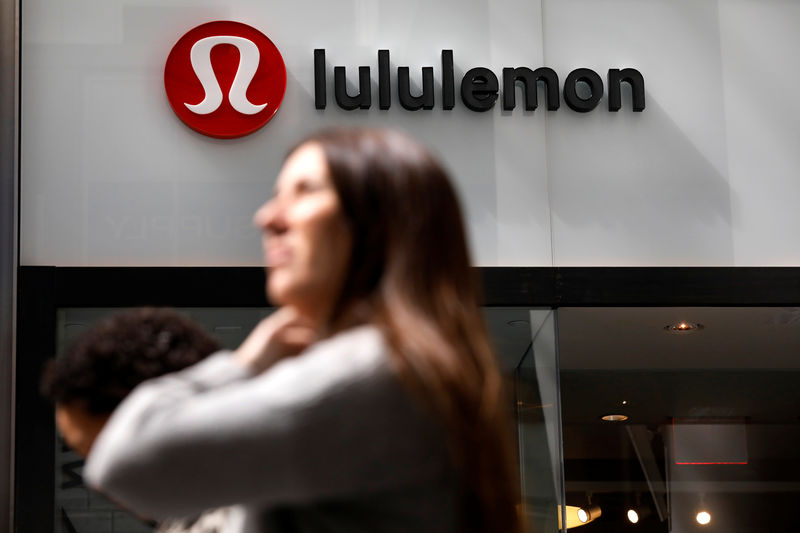
This new trend was confirmed with an impressive earnings report from Lululemon Athletica Inc. (NASDAQ: NASDAQ:LULU), which is Friday's Pre Market Prep Stock of the Day.
Lululemon's May Low: The issue bottomed in between the high price-to-earnings-growth technology sector, which bottomed in mid-May, and the S&P 500 index, which bottomed in late June.
On May 25, Lululemon made a low at $251.51 and rebounded to close at $260.66, and was back over $310 only 10 sessions later.
That explosive rally did not hold, and the stock made another significant low on July 5 at $258.78. Once again, it rebounded sharply off that low to end the day at $283.62.
Lululemon's August Peak: Lululemon peaked one day after the S&P 500 index on Aug. 16 at $335.71 and posted its highest close for the rebound on Aug. 18 at $333.42.
The issue went into retreat mode with the broad market and made its low for decline on Thursday at $283.31, the same as the index. It rebounded sharply off that low to close at $294.45 ahead of the report.
Lululemon's Q2 Beat, Higher Guidance: After the close on Thursday, the company reported quarterly earnings of $2.20 per share, which beat the analyst consensus estimate of $1.86 by 18.28%.
The retailer reported quarterly sales of $1.9 billion, which beat the analyst consensus estimate of $1.76 billion by 7.95%.
In addition, the company forecast third-quarter EPS of $1.90-$1.95 vs. a $1.78 estimate and sales at $1.78-$1.805 billion vs. a $1.73-billion estimate.
For 2022 as a whole, Lululemon said it expects adjusted EPS in a range of $9.75-$9.90 vs. a $9.44 estimate and sales of $7.865-$7.94 billion vs. a $7.69-billion estimate.
PreMarket Prep's Take: When the issue was being discussed on the show, it was trading sharply higher by nearly $28 at the $322 area. Both hosts of the show said that despite the outsized gain, the issue was holding strong.
“Nice lift, but I am not going to chase in the current market environment," said co-host Dennis Dick.
“This company seems to be firing on all cylinders and expects it to continue.”
The author of this article noted a potential upside target at the pair of highs just under $325 area from Aug. 25 ($323.59) and Aug. 26 ($324.90), Investors were alerted that in the event the issue breaches that area on continues higher, a retreat back down through that level may instigate a deeper retreat.
LULU Price Action: After the much higher open above the aforementioned resistance Friday, the issue continued in the same direction. It finally peaked just above its Aug. 19 high ($329.02) and reversed course.
Lululemon was trading 6.65% higher at $314.02 Friday afternoon.
Watch the discussion on Lululemon here:
Photo via Shutterstock.
© 2022 Benzinga.com. Benzinga does not provide investment advice. All rights reserved.
Read at Benzinga
