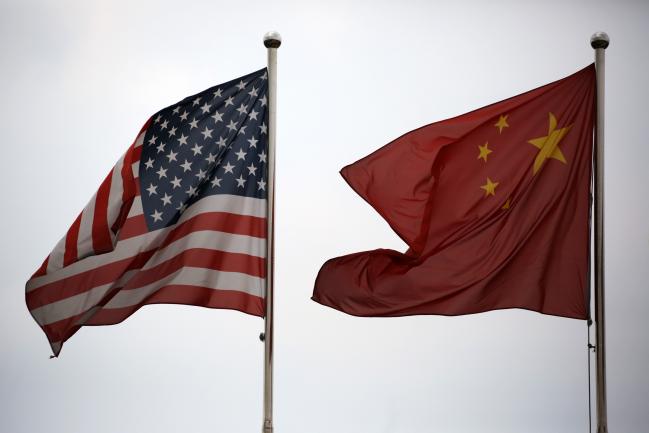
(Bloomberg Opinion) -- The saber-rattling for a U.S.-China trade war is becoming louder, and many observers are speculating about which country will blink first. One important variable will be the resilience of each country’s stock market, given the potential for mayhem from a melting market. So it’s worth asking which one is more likely to stand its ground.
There are several considerations, most prominently quality, free float and valuation. Let’s see how they stack up for each country.
Quality
Higher-quality assets tend to hold up better in a crisis.
The MSCI China IMI (LON:IMI) Index — a collection of large-, mid- and small-cap companies — posted a higher profit margin than the MSCI USA IMI Index in each of the last nine years, the longest period for which numbers are available for both indexes. And not by a little. The China index had an average profit margin of 11.3 percent from 2009 to 2017, compared with 7.4 percent for the USA index. The China index’s return on equity was also higher every year except 2016.
Those results can’t be attributed to leverage despite widespread fears that Chinese companies are drowning in debt. The China index’s debt-to-equity ratio averaged 121 percent from 2009 to 2017, compared with 114 percent for the USA index. Even when adjusted for modestly more debt, China’s companies have been far more profitable.
Chinese companies have also enjoyed more stable earnings growth. The standard deviation — a common measure of volatility — of year-over-year earnings growth for the China index was 12.8 percent from 2010 to 2017, compared with 13.3 percent for the USA index.
Edge: China
Free Float
A certain percentage of companies’ shares are held by promoters or insiders or, notably in the case of China, the government. As a practical matter, those shares are not available for trading, which is a problem in China. The average free float percentage for stocks in the USA index is 89 percent, compared with 50 percent for the China index.
The reason it matters is that less float translates into more volatility. That’s evident when comparing the price movement of each index in its local currency. The standard deviation of the USA index was 14.8 percent from June 1994 through May, compared with 32.7 percent for the China index, or more than double the volatility.
It implies that Chinese stocks react more harshly to bad news, and that’s been true since the tariffs were announced. The China index is down 3.2 percent over the last four trading days through Wednesday, while the USA index is down just 0.3 percent.
The fact that the Chinese government has a stake in the stock market isn’t likely to help. As my Bloomberg Opinion colleague Shuli Ren pointed out on Thursday, the government tried and failed to lift stock prices three years ago. Its current attempt is failing, too.
Edge: U.S.
Valuation
By nearly any measure, China’s stock market is much cheaper. The USA index’s price-to-earnings ratio is 46 percent more expensive than that of the China index. Its price-to-book ratio is 75 percent higher. And its dividend yield is 0.3 percentage points lower.
A lower valuation doesn’t necessarily mean that China’s market will hold up better in the weeks or even months ahead because there’s no meaningful correlation between valuation and short-term market movements. But it does mean that China’s market has less room to fall, which could dampen the severity of a sustained downturn.
It’s worth noting that both markets are home to a comparable proportion of large companies, which are more likely than smaller ones to export their goods and services and therefore suffer the effects of the tariffs. Roughly 25 percent of the stocks in the China index have a market capitalization greater than $10 billion, compared with 22 percent in the USA index.
Edge: China
So what does all this mean? In the near term, thin trading in China’s stock market would most likely result in more drastic declines than in the U.S. But China’s cheaper and higher-quality market appears to be better positioned to weather a sustained conflict.
