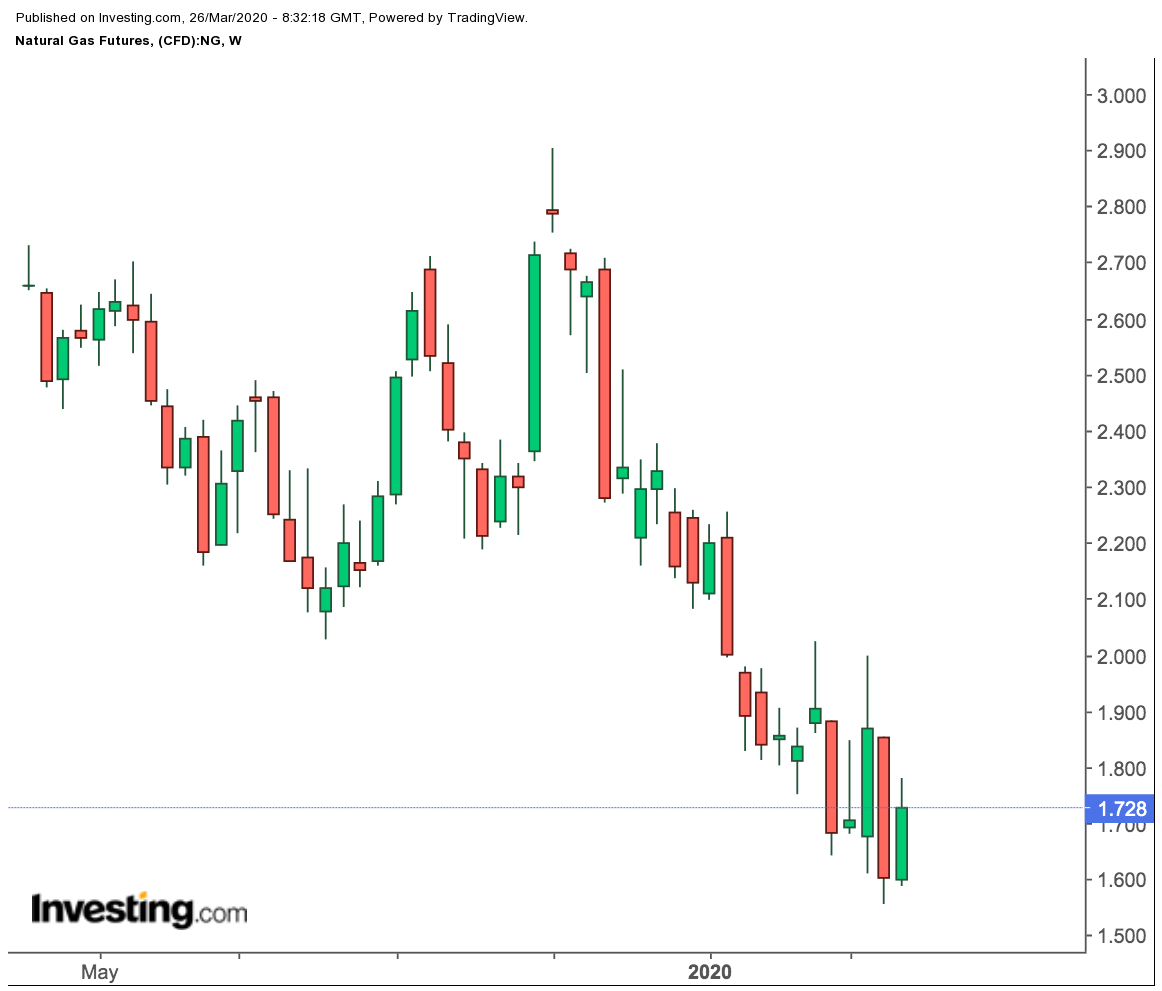
A week ago, I suggested to readers who were long gas that the worst might not be over yet for them.
My conjecture was based on the 25-year low of $1.56 hit by the front-month gas contract for each million metric British thermal unit traded on the New York Mercantile Exchange’s Henry Hub on March 18.
With the coronavirus pandemic practically shutting down offices across half of America, I reckoned that commercial demand for early spring heating would be whittled down to almost nothing and that anxiety levels ought to be high for anyone bullish gas.
That post earned the ire of some who were already — or planning to go — long gas, with comments that alluded to the all-time highs in natural gas shorts that they contended had to be reversed soon.
Others argued that with millions of Americans staying in their homes in an attempt to contain the viral outbreak, residential demand for gas would spike instead, offsetting the drop in commercial heating.
Gas Entered A New 25-Year Low
Since that article ran, gas futures have gone even lower, though not far from that original 1995 low. On Monday, March 23, Henry Hub’s front-month slid to $1.52 per mmBtu, before rebounding.
At the time of this article’s writing, the front-month was doing much better, hovering at $1.69 as a function of some volatility and marginal improvement in weather support from a couple of colder-than-normal days last week.
But the broad overview from last week still holds true: spring could bring more gloom than hope for gas.
Weather models this week continue to indicate the same, especially after a sobering note from Goldman Sachs which published its projections for earliest light in the post-spring tunnel.
Goldman Sees Gas Under Pressure Through Summer
“The combination of lower U.S. gas production with a global recession this summer has set the stage for a ‘whiplash’ in U.S. natural gas markets,” Goldman said.
“Specifically, we expect that the cut in associated gas production, although significant, will show in U.S. gas markets late enough this year that end-summer 2020 storage will likely face record-high levels, keeping summer prices under pressure.”
Wall Street’s leading voice in energy said that as natural gas storage entered the 2020/21 winter, production declines were likely to be visible enough for gas prices to rally sufficiently sharply for summer 2021 to reach “comfortable inventory levels” again.
Goldman adds:
“Although we expect demand to fall sharply in 2Q20, larger-than-initially-expected production declines suggest U.S. gas balances will not likely require Appalachian production shut-ins in summer to balance the market.”
“As a result, we raise our 2Q20 NYMEX natural gas price forecast marginally to $1.60/mmBtu from $1.50/mmBtu, which still reflects our view of a strong need for C2G (coal-to-gas) substitution.”
Accordingly, Goldman said its has raised its 2020/21 winter and 2021 summer forecasts to $3.50/mmBtu and $3.25/mmBtu — easily double today’s prices.
Range-Bound Trades, With Occasional Stab Lower Seen
But for now, it’s range-bound trading, with the occasional sharp lunge lower that could set deeper lows than those seen in 1995 or 1994.
“I expect to see continued weakness as the back end of the market has ‘value’ to it, but the front does not,” Scott Shelton, energy futures broker at ICAP in Durham, North Carolina, said in a note on gas earlier this week.
“I am just not a believer in the front end of the market as I believe that the bottom is going to drop out on industrial demand next month,” Shelton wrote.
Following the abnormally-low draw of 9 billion cubic feet from storage for heating during the week ended March 13, analysts were calling for a decline of 25 bcf last week when the U.S. Energy Information Administration issues its weekly gas storage report at 10:30 AM ET (14:30) today.
Despite the bump-up from the previous week’s draw, the 25 bcf pull — if true — will still be lower than the draw of 39 bcf during the same week a year ago and the five-year (2015-2019) average withdrawal of 40 bcf for the period.
Dan Myers at Houston-based Gelber & Associates, a consultancy that tracks risks in gas trading, said he expects the EIA to reveal another uninspiring gas draw for the current week in its next dataset due on April 2.
“Following that, we’ll turn to modest net injections from early April onward,” Myers said, referring to the warmer trends expected by then across the Northeast, the hub of gas-fired heating demand.
Disclaimer: Barani Krishnan does not own or hold a position in the securities he writes about.
