After a banner month in April, cryptocurrencies had an appalling May. Headlines were dominated by news of a U.S. criminal investigation into whether traders are manipulating the price of Bitcoin and other major digital coins.The U.S. Department of Justice, along with the Commodity Futures Trading Commission, opened a criminal probe on May 24 into the possibility that traders are using illicit tactics, such as spoofing — where an investor places orders that are intended to manipulate the price of an instrument — and flooding the market with fake orders.
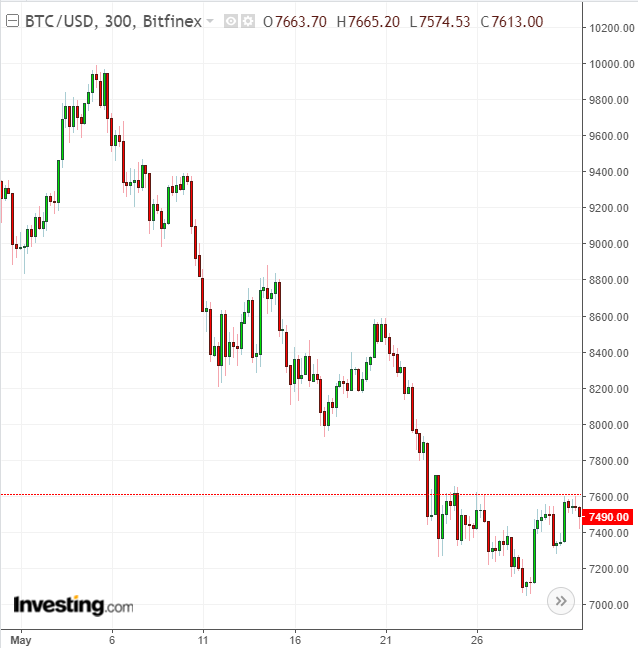
The investigation, which is still in its early stages, is the U.S.’s latest effort to crack down on an industry that was initially embraced by those who were distrustful of banks and government control over monetary policy.
Even before news broke of the U.S. investigation, some market participants have alleged that crypto manipulation is rampant. Last year, a blogger flagged the actions of “Spoofy,” a nickname for a trader or group of traders that have allegedly placed $1 million worth of orders without executing them.
Additionally, on a technical basis, most digital currencies failed to break out of their downtrends and rise back above their respective 200-day moving averages. This usually signals that sellers are still in control.
When taking these developments into consideration, the prices of nearly all the big-name mainstream cryptocurrencies cratered this month, with the value of the crypto market has a whole shrinking by almost 15% from a month earlier to $351 million.
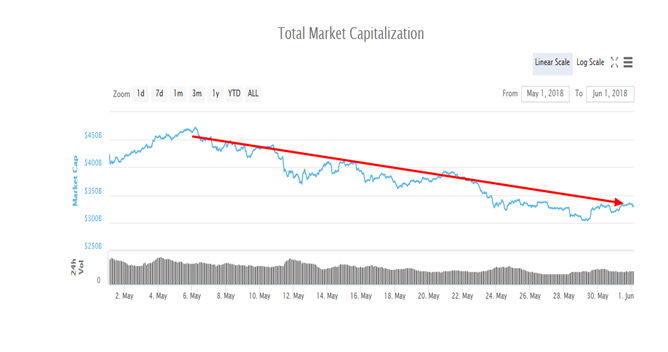
Source: Coinmarketcap
Highlighting just how bearish the action in cryptos was in May, there are now 24 digital currencies with a market cap greater than $1 billion, compared to 27 at the end of April. Of the 24, all but one closed the month lower than where it had started on the final trading day of April.
Below we take a look at some of the biggest losers among the most valuable cryptocurrencies that logged the largest declines over the past month. We also focus on the one, surprising, coin that managed to end the month with gains.
[Note: This post should not be considered an endorsement, nor investment advice. It’s merely reportage. Do your own due diligence before investing in any particular asset or asset class. Coin statistics were collected on May 31, 2018. Values might differ depending upon when this article is being read.]
3 Biggest Losers
1. NEM (XEM/USD): Down 40% In May
NEM is a peer-to-peer cryptocurrency and blockchain platform that was launched on March 31, 2015. Built with businesses in mind, NEM's blockchain is designed to offer a streamlined method to maintain a secure ledger of transactions.
The price of one NEM coin changed hands at $0.40449 on May 1, before sliding to $0.22809 on May 27, its lowest since April 6. It finished the month at $0.25417 for a monthly loss of 40%. At current prices, NEM ranks as the 15th biggest cryptocurrency in circulation, with a market cap of roughly $2.3 billion.
Year-to-date, NEM is down 74%, making it the second biggest crypto loser of the year, trailing only Qtum.
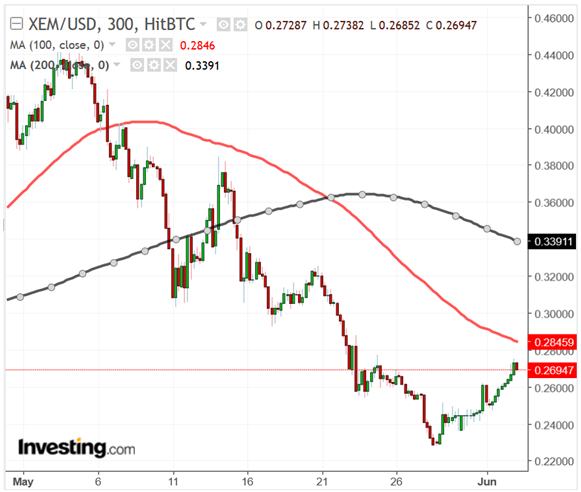
Like many other alt-coins in the market, NEM has seen its value shredded by the ongoing decline in prices, though there has been no particular reason for the selling. From a technical standpoint, price action remains negative as long as it stays below the key 100- and 200-day moving averages.
That said, NEM could be in the process of bottoming, as prices started to recover during the last few days of May, which could make it a compelling buy going forward. The gains came as the company announced on Twitter that it had launched its Catapult ecosystem on the public network. The game-changing network upgrade was then released during Coindesk's Consensus 2018 blockchain technology summit.
Catapult, also known as Mijin v.2, is a full-featured blockchain engine delivering a new version of the NEM protocol for both public and private networks for the enterprise.
2. Cardano (ADA/USD): Down 34.5% In May
Cardano is a technology platform that runs the Ada cryptocurrency. Launched by blockchain development firm Input Output Hong Kong (IOHK) and led by Charles Hoskinson, former co-founder of Ethereum, the platform is capable of running financial applications, smart contracts, and decentralized applications.
Cardano's price on May 1 was $0.35490, before plummeting approximately 35% to end the month at $0.22028. The digital currency reached its worst level since April 11 at $0.17093 on May 28. It is currently the seventh most valuable digital token in circulation with a market cap of around $5.6 billion. It ended April with a market value of $8.5 billion.
Cardano is down 68% so far this year, making it one of the worst performing cryptocurrencies of 2018 at this point.
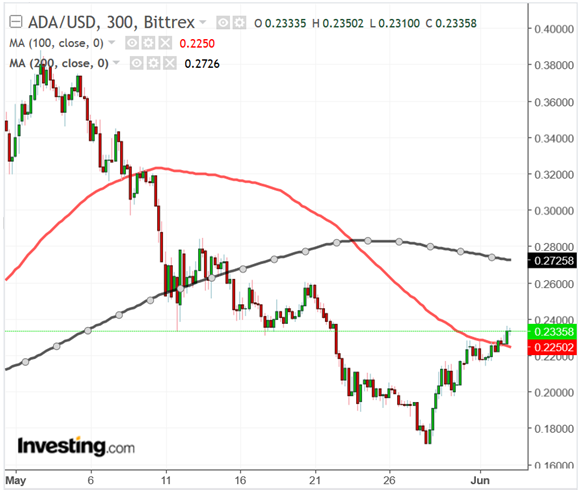
Like the rest of the crypto asset class, Cardano has been in a downward spiral for the past few weeks, with no fundamental catalyst in particular driving the sharp downward movement. It seems that Cardano prices managed to halt their decline in the last week of May after Hoskinson tweeted on May 28 that the ADA platform had launched its first smart contracts testnet.
The announcement puts Cardano one step closer to achieving its aim of becoming a platform for smart contracts, decentralized applications, side chains and multi-party computation. Cardano plans to release another testnet sometime in July.
From a technical standpoint, ADA/USD needs to stay above its 100DMA close at $0.22502 in the near-term to show that selling pressure has been exhausted. That could open the door for a move higher, to the $0.30-level.
3. NEO (NEO/USD): Down 34.2% In May
NEO, dubbed by many cryptowatchers as the 'Ethereum of China' because it was developed by a Chinese firm, is a blockchain platform and cryptocurrency which enables the development of digital assets and smart contracts. The price of one NEO coin changed hands at $84.11 on May 1, before sinking to $47.31 on May 28, its weakest level since April 7.
The alt-token ended the month at $55.61, a monthly decline of roughly 34%. Year-to-date, NEO is down approximately 27% after starting the year at $78.30.
At current prices, NEO ranks as the 11th biggest cryptocurrency in circulation, with a market cap of roughly $3.7 billion.
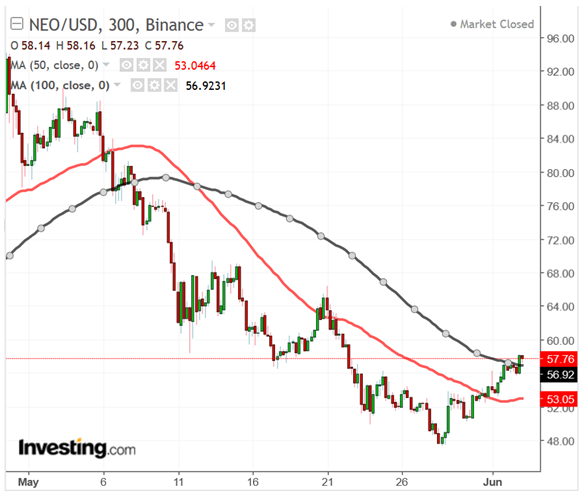
For the most part there has been no particular reason for the recent slide in NEO's price, mirroring the price slumps experienced by nearly all of the top 20 cryptocurrencies in the market during May. Similar to NEM and Cardano, NEO's chart indicates that the digital currency may have hit a bottom in the short-term, as it rallied sharply in the last few days of May.
Crypto traders attributed the move higher to encouraging comments made by Chinese President Xi Jingping in a May 29 speech where he publicly endorsed blockchain technology. Speaking during a forum of the Chinese Academy of Sciences and Engineering, one of the most powerful leaders in the world said:
“A new generation of technology represented by artificial intelligence, quantum information, mobile communications, internet of things and blockchain is accelerating breakthrough applications.”
Though he remained critical about cryptocurrencies in general, local media in China has started to call for a lift of the crypto ban in the Asian country.
May's Single Winner
1. Bytecoin (BCN/USD): Up 21.8% In May
Bytecoin, released to the public during March 2014, is the first cryptocurrency based on the CryptoNote technology with an open source code designed for anonymous cash settlement. Since its launch, several improvements have been made, including multi-valued transactions and several security updates.
Bytecoin ended May 31 at $0.006445, for a gain of approximately 22% during the month. Its opening price on May 1 was $0.005270, before the alt-coin surged 68% to an all-time high of $0.020152 on May 8. At current prices, it has a market cap of nearly $1.2 billion, making it the 21st biggest digital currency.
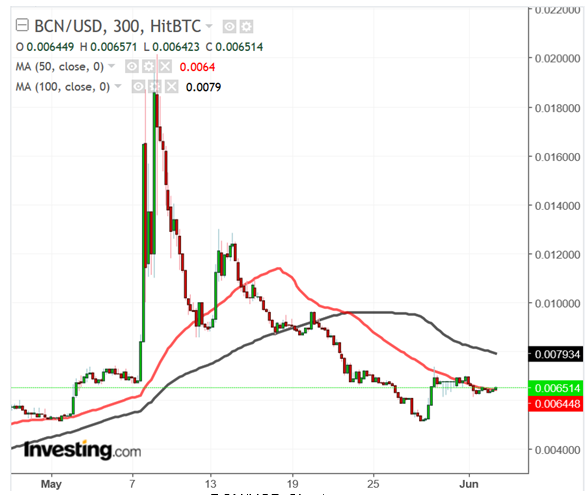
The sudden rise in the price of Bytecoin followed an announcement on May 8 that it was beign listed on Binance, the world’s largest digital exchange. However, prices quickly came well off those levels amid concerns by many in the Bytecoin community that the coin was a pump and dump scheme.
That prompted the Bytecoin team to respond on Reddit by saying that they have no control over what direction the price of the coin takes. All they can control is the underlying software of the token. They also added that Binance never gave them information on a time of the listing as earlier assumed by the community.
In terms of the chart, the action in Bytecoin currently looks less constructive than some of its peers, with prices struggling to break above resistance near the 50DMA.
