Global equity markets have steadied today. This after yesterday's selling rout, which was spurred by fears of the potential economic hit that a spreading coronavirus outbreak could wreak on world financial markets. Nonetheless, some sectors continue to sag—leisure travel and container shipping are particularly pressured.
Not surprising, since the epidemic has cropped up more aggressively outside of China in recent days, it has weighed on all types of transport-related stocks including both travel companies and freight carriers.

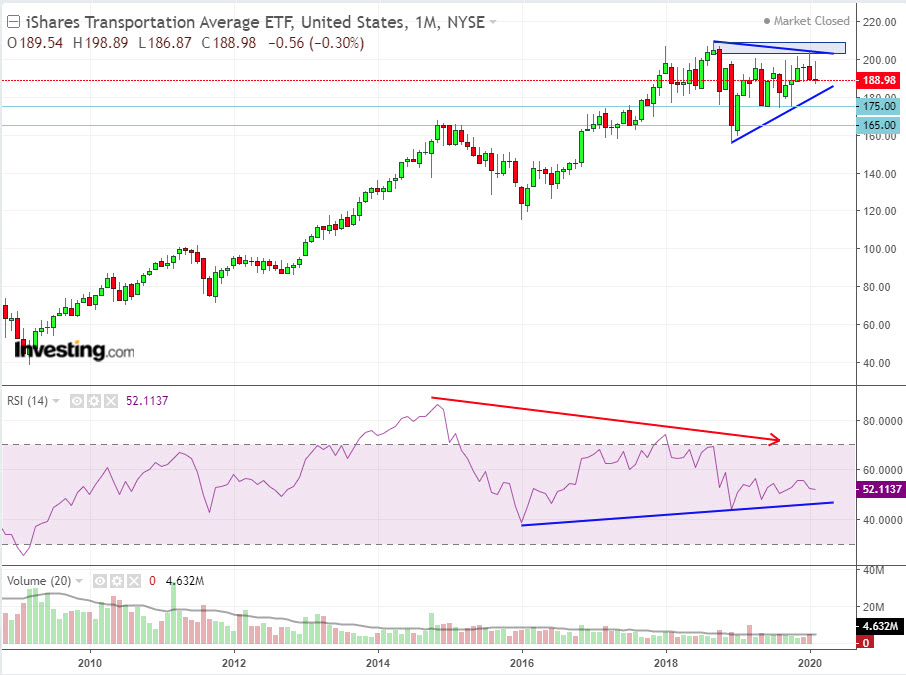
The iShares Transportation Average ETF (NYSE:IYT) is moving inside a tight triangle (similar to the SPDR S&P Transportation ETF, XTN, discussed yesterday). There's pressure from the supply zone (light blue rectangle), and a prominent bearish divergence in RSI. The two nearest support levels below the triangle are 175 and 165.
The ETF's primary holdings break down as follows: shares of ground freight and logistics companies, 53.83%; air freight and courier services stocks, 19.42%; while 17.73% are airlines (including United Airlines Holdings (NASDAQ:UAL), which was also featured in yesterday's post), 17.73%.
Some companies, however, through no fault of their own, are at the epicenter of events. Ever since Feb. 12, when the Japanese health ministry announced that the Diamond Princess, a cruise ship then docked in Yokohama, had 175 people infected by the virus (three have since died), cruise operators were immediately dumped by investors. That ship, owned by the Carnival Corporation (NYSE:CCL) remains under quarentine, but other segment stalwarts have become 'infected.'

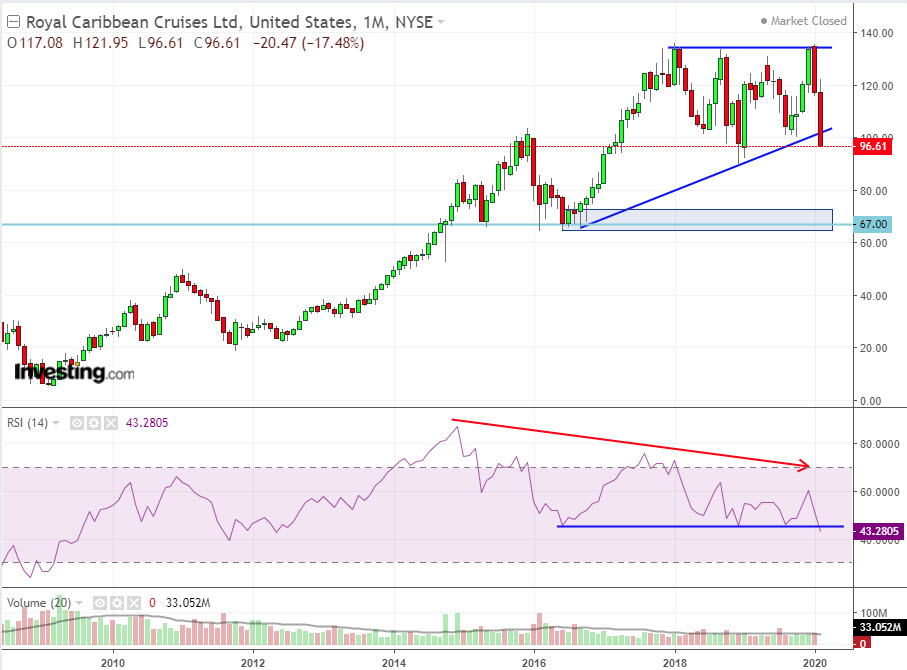
For example, yesterday, Royal Caribbean Cruises (NYSE:RCL) broke below the bottom trendline of its ascending triangle. If the monthly and weekly candles close below this line, it could be heading lower, down to the demand zone and support line of 67-70. The RSI is showing a strong bearish divergence, which yesterday broke below the support line (blue). That's another bearish signal for the stock.
MAERSK (CSE:MAERSKa), the Danish transport, logistics and energy conglomerate, is the largest container ship and supply vessel operator in the world.

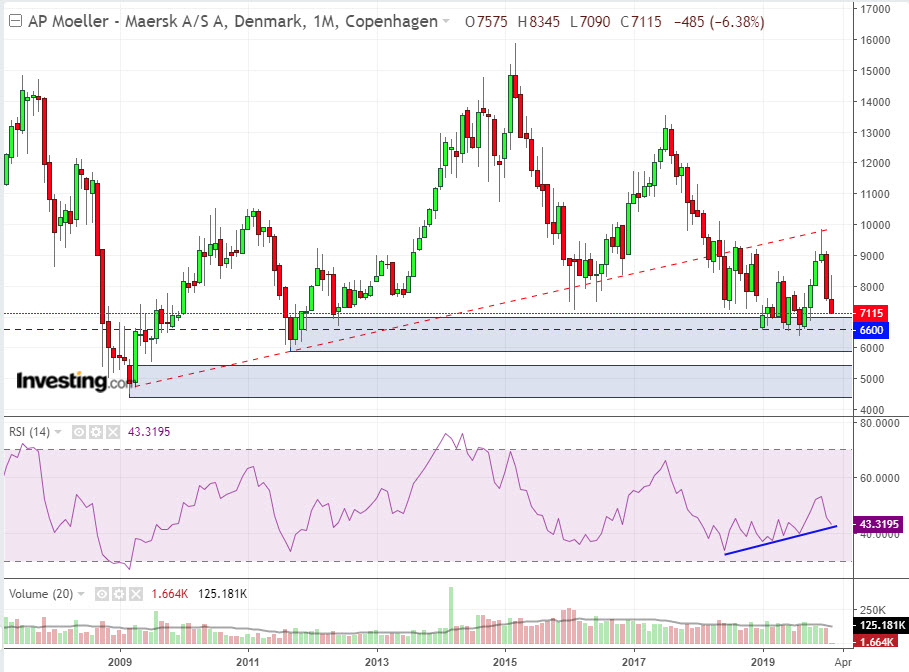
Since its all time high of 15,860DKK in March 2015, the company's stock has been pummeled. It's down 56%, and is now testing the demand zone (between 6,000-7,000) that was established in 2011 (upper blue rectangle). Another historical support line resides inside this zone, at 6,600. If these areas of support yield to the strong bearish momentum, the next demand zone awaits between 4,400 and 5,500.

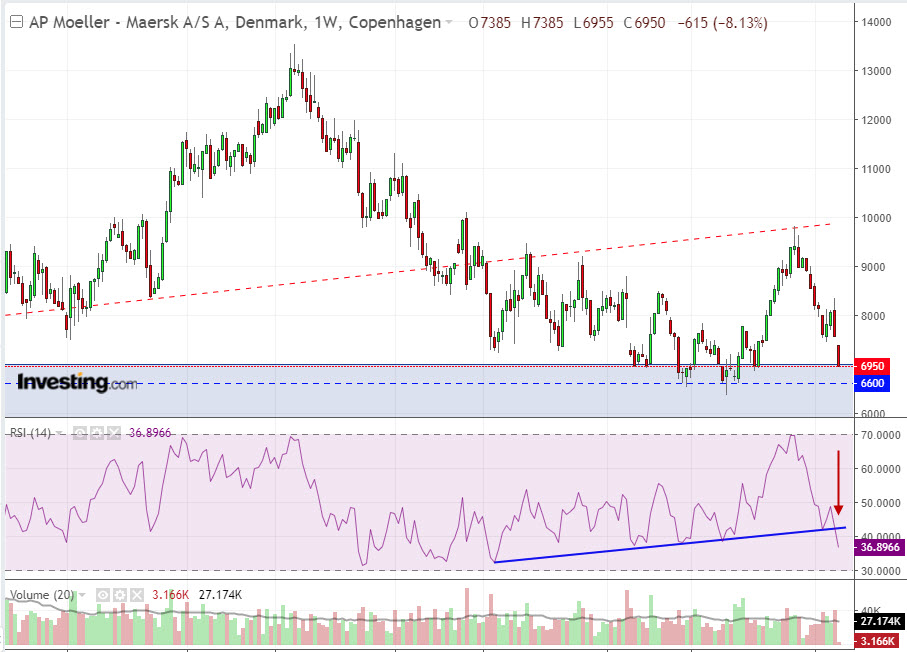
On the monthly chart the RSI is holding above the uptrend line (blue), but on the weekly chart the oscillator has broken below the line, a sign of additional weakness for the stock.
