Look at that – can the Dow really be at 32,950???
The UK gilt and sterling market banker bigwigs seem to be happy that one of their own (by sheer coincidence an ex-Goldman banker) Sunak is now at the helm. But I am not so sure of the public. One of the great ironies of politics is that when the establishment and the media gang up on a PM to get rid for their own nefarious purposes, they succeed in manipulating public opinion against her, despite the message she offered of a better future than the alternative of even higher taxes, more regulations and a weaker economy. They are like turkeys voting for Christmas!
And now they have a more photogenic PM who is about to kill any hope for any change to the status quo – as illustrated by the renewed ban on fracking that could make us a lot more energy independent (in time). The push to Net Zero by this government almost guarantees blackouts if we get a cold winter according to the National Grid (LON:NG). What if the wind doesn’t blow at night for days on end and NatGas supplies in Europe are constricted?
Personally, I have good supplies of wood and coal in my home, as have many in Germany I see. Their virtue signalling eco politicians have doomed them to fending for themselves in their quest to save the planet. Which of course doesn’t need saving except for the disgusting amount of rubbish floating in our oceans that is harming the creatures there. But I see major clean-up operations have started and the problem is likely to being at least partly solved.
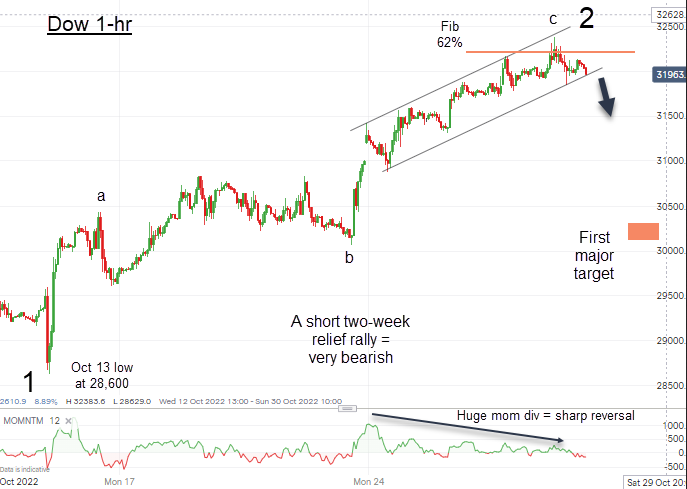
Last week in these pages I proposed the idea that the relief rally could last until the US mid-terms on November 8. But with the Dow having surged strongly in just two weeks to the important Fib 62% level, there was a high probability the rally top was at hand on Thursday at the 32,400 level.
This was my chart I posted Thursday showing the potential for a break out of my minor tramlines
Not so – that high odds outcome was overridden by Friday’s huge 800 pip advance to the 32,950 level to a new high for the move and right at the Fib 76% retrace. That surge has all the hallmarks of an extended short squeeze (low NYSE trade volume on Friday). And that new high was not matched in the Nasdaq or the S&P.
Once again we have a fractured stock market. And that is the usual backdrop to a swift reversal. And this is the updated chart showing the Relative Strength Index (RSI) at the highest level above the 70 line – even higher than it was at the wave 2 August high!
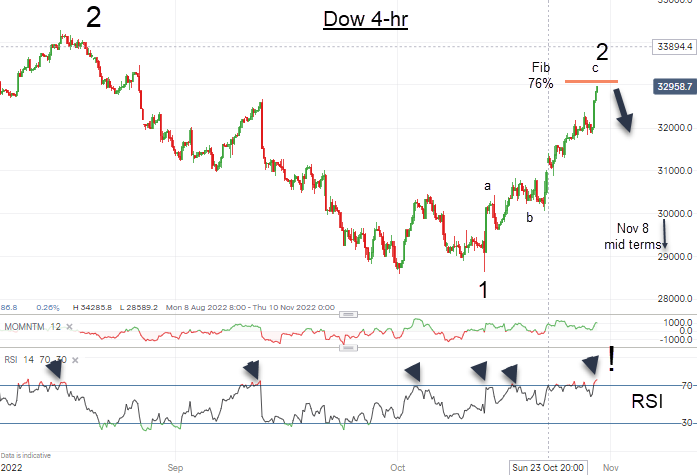
Not only that, but it has reached my ‘last chance saloon’ Fib 76% for a retrace starting Monday. A gap opening at the Monday NYSE cash open would confirm the top is in.
Now I did have my target date for the top around 8 November (see last week’s blog) – over a week away. But with the market historically extremely overbought – last week it had six successive up days (highly unusual) – odds are very high a reversal is at hand sooner than I had suggested. We shall soon see.
Yes, it has been very frustrating to see all normal levels of reversal swept away. But that is typical of second wave rallies in bear markets. They can extend much farther than they ‘should’. The key though is to have some firepower that you can deploy when the inevitable turn down starts. And when it does, the declines will be very rapid.
But if the market can move above the August high at 34,300, that would change the picture dramatically. But I see that at very low odds. But possible. In markets, all things are possible, but some are more likely than others (h/t to Mr George Orwell).
We know the Fed is walking a fine line between trying to ‘fight inflation’ with large interest rate spikes and trying not to engineer a stock market crash with them.
Already, we see US housing markets are cooling very rapidly with activity growing weaker but prices remain high and have not cracked yet except in the mega mansion category. But it seems inevitable they will with mortgage rates pushing 6% or higher.
So has the US bullish enthusiasm spilled over into our FTSE 100? After all, if the US (which leads the global economy) is feeling uber bullish, surely our markets should reflect that to some degree.
But that seems not to be the case:
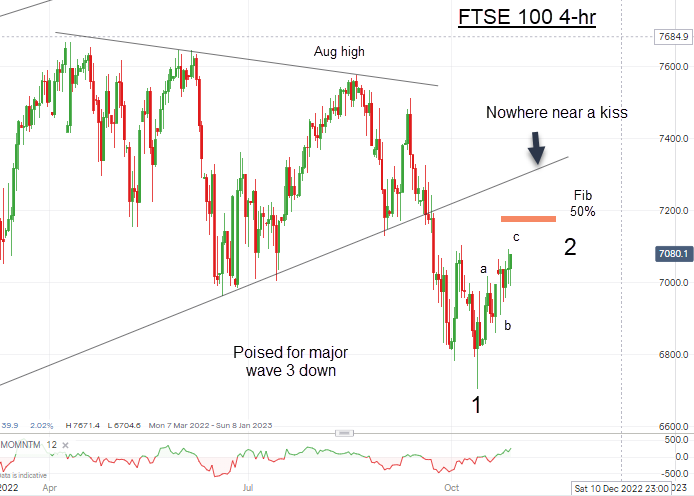
The rally off the wave 1 low has been pretty pathetic and is not even close to a Fib 50% retrace of wave 1 off the August high (while the Dow has retraced a Fib 76%). It seems a normal kiss on the lower trendline is well off the table.
We may se a little more follow-through strength early next week into the Wednesday Fed report to approach the Fib 50% test, that should be the extent of any rally and when wave 3 down starts, it will move very rapidly along with the US indexes.
But what is the macro background -is that supportive to higher asset prices? No, it remains bearish with central banks engaging in QT as they reduce their assets (bonds) and this is restricting the money supply. Interest rates remain trending up with sharp rises recently. Inflation remains persistent and if, as I suspect, crude oil prices have started a major rally phase, then consumer prices will follow. This is all putting a crimp on consumer spending as has been noted by most retailers. Conservation of resources is paramount now.
But the bulls are banking on the Fed easing up on their hawkish stance and we shall soon see about that with the upcoming report due Wednesday. With US markets at extreme levels of short-term bullish fervour, can it get any higher even if the Fed is seen as softening somewhat? Thus, the early part of the week should be defining.
Bitcoin in weak rally so far
Bitcoin and Tesla are my two main litmus tests for general bullish speculative fever in markets. And although Bitcoin has managed to break up out of its tramline channel, the rally so far is exceedingly weak. Remember, the cryptos have been trading with shares more or less.
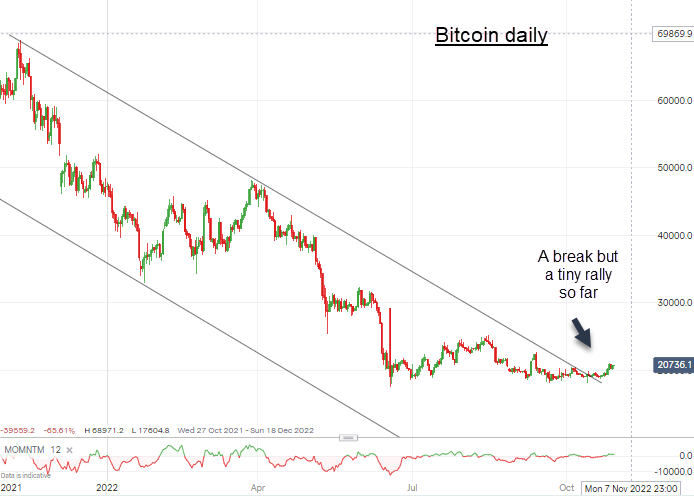
With the stock indexes now vastly short term overbought (see above), it appears unlikely Bitcoin can manage to move much higher in an impulsive manner. But the tramline break tells me the short term trend is up.
Tesla shares likewise have only just moved off the low and shows no signs of taking part in the Dow euphoria despite latest data showing the model Y was the best seller in Europe last month. Hmm.
NatGas is cheap – and winter is coming!
Overproduction of NatGas in the US shale patch especially (with excess being flared) has produced a near 50% drop in prices – right to a significant support level and on a mom div. Forecasts for a mild start to winter in the US and high crude production (gas is a by-product) has had the desired effect of dropping prices. But what if UK and Europe mainland has several harsh periods this winter (not unheard of)? It will import LNG from the USA! That will lift US prices off the floor
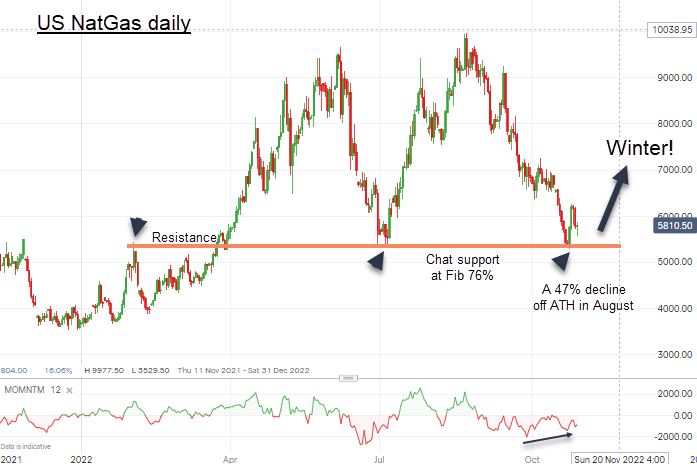
Ned I say any more? I am planning a major bull campaign for VIP traders Club. I se this as a major opportunity.
