In a word, stagflation. That’s how I’d sum up what this market angst is all about. Or at least, the spectre of stagflation. Simply put, growth is already decelerating and downside risks to the growth outlook are darkening due to rising cases, Delta and other emerging variants, as well as worries about potentially lower vaccine efficacy. At the same time, inflation is shooting higher. Supply side constraints (supply chain tightness, availability of labour/parts) are a problem central bankers cannot solve.
As I detailed on August 12th 2020, the Fed was always going to struggle to get a grip on inflation as it let the economy run hot – AIT was developed before the vaccines had their effect and the Fed has been slow to respond. (US inflation hot, stocks keep higher as bonds slip). “The Fed should and could be relaxed about headline inflation running above 2% for a time, instead prioritising the employment level, but it also means inflation expectations can start to become unanchored as they did in the 1970s […] In a nutshell, if inflation expectations lose their anchors, then we are faced with a stagflationary environment like nothing we have seen for 50 years. High inflation, low growth for years to come is the unwanted child of a global pandemic meeting massive government intervention. And, expounding further on Aug 13th: “The risk is that inflation expectations can start to become unanchored as they did in the 1970s when the Fed had lost credibility, this led to a period of stagflation and was only tamed by Volcker’s aggressive hiking cycle.”
Are we going to see another Volcker? I doubt it very much, I doubt central bankers have the bottle or mandate even (full employment, remember) to engineer a recession to get everything back on an even keel.
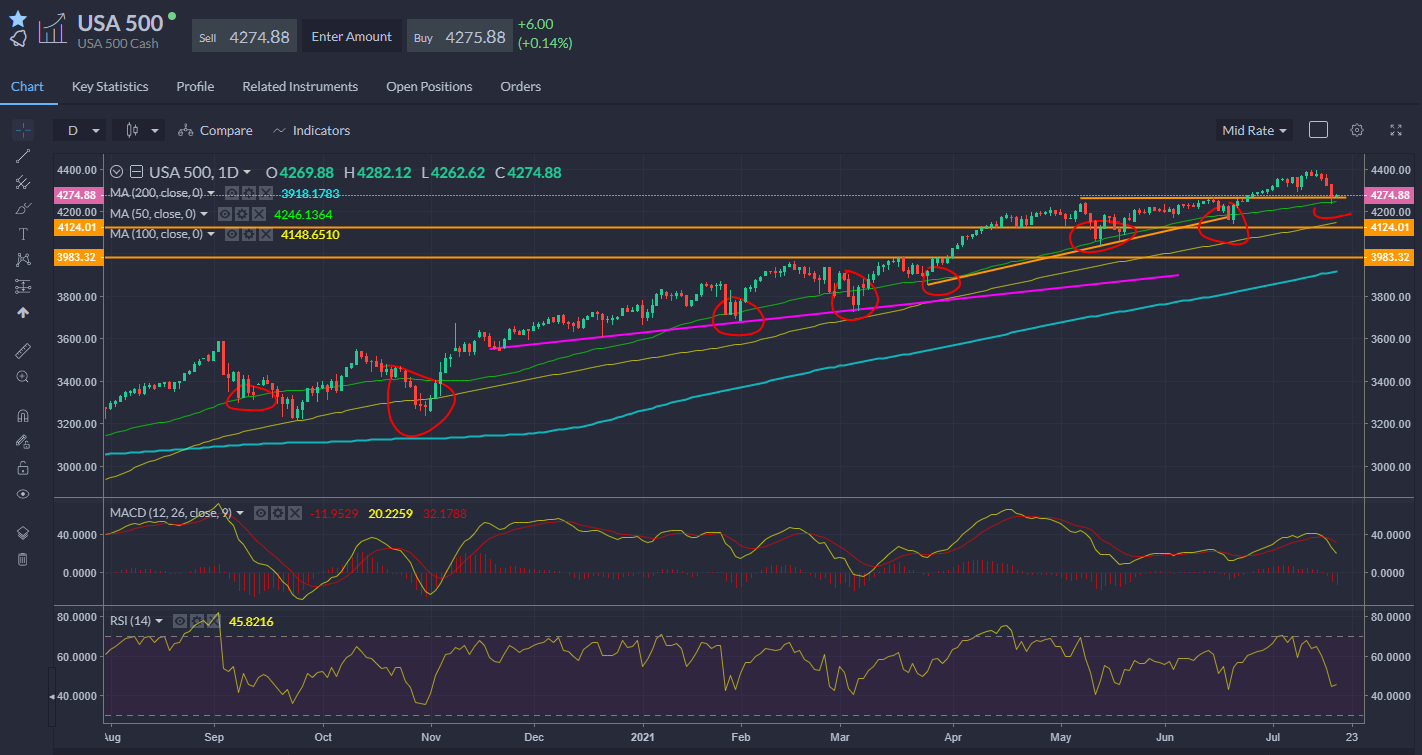
Stocks slumped at the start of the week and bonds rallied, sending the United States 10-Year benchmark to its lowest since February at 1.17%. The S&P 500 declined 1.6%, whilst the Dow Jones industrial average was more than 2% lower for the session, though both closed off the lows of the day. It was the worst single day for the Dow since October, as the major cyclical plays - energy and financials – led the losers. The S&P 500 briefly traded below its 50-day SMA but managed to close above this level, and managed to just hold onto our horizontal support drawn across the May-Jun peaks. The Vix spiked to 25.
As previously noted here, the whole story of the bull run since the vaccine news/Biden win in Nov is littered with ~5% type pullbacks to that 50-day line, before the uptrend is resumed. Could it be different now? Perhaps, but it would be betting against form to suggest so. We’re only about 3% off the recent all-time high and this pullback may not be over until at least that becomes a ~6% drop to about the 4150 area. Cyclicals have been selling off for a while now and the market was being propped up by an ever-narrower base of mega cap tech/growth.

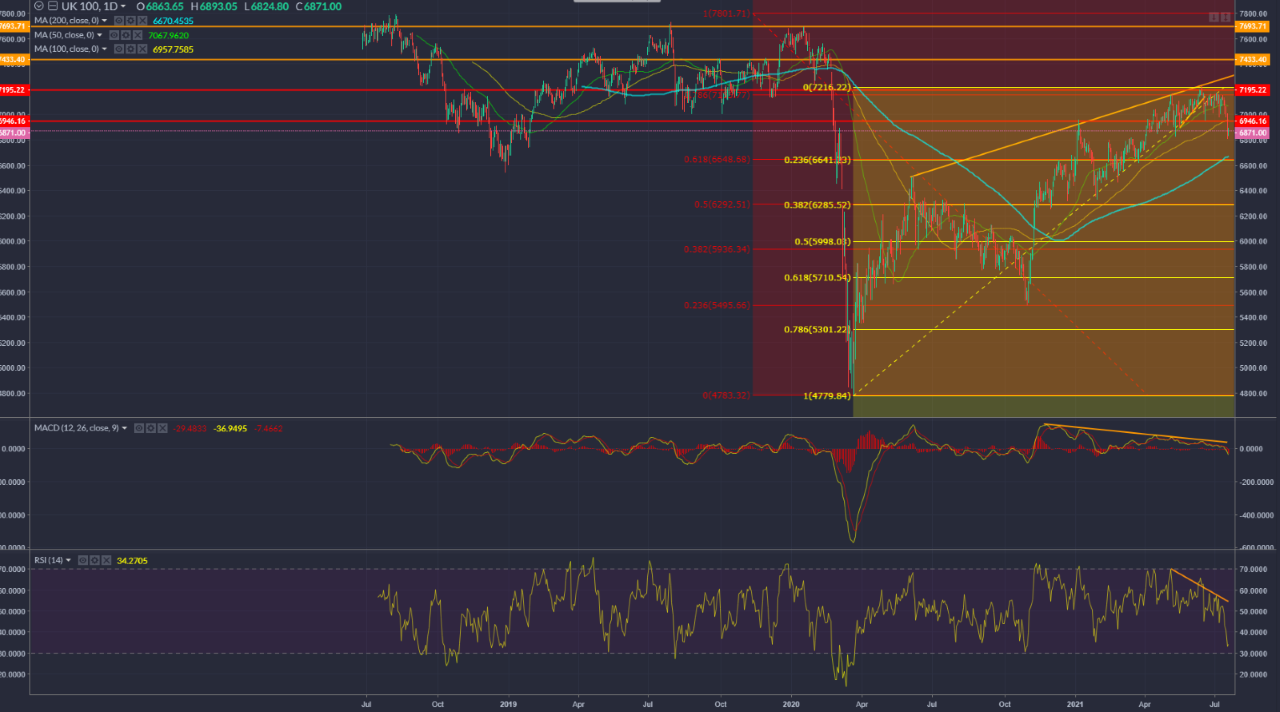
European indices endured a brutal session, with all the major bourses registering declines of more than 2% for the day. The FTSE 100 tumbled through its 100-day moving average, hitting a three-month low. In early trade, stock markets in Europe staged a fightback, but I’d flag the risk that this a) a deceased feline and in any event b) is a market in a summer funk that can cut you up in both directions. UBS (SIX:UBSG) boosted sentiment with a net profit of $2bn for the quarter, up 63%. EasyJet (LON:EZJ) shares rose as it signalled it would fly 60% of Q4 2019 capacity in the final quarter.
The FTSE rolled over after failing to sustain the 78.6% retracement above 7,200. Starting to look a tad oversold and we should anticipate a retest of 7,000 but further weakness cannot be ruled out a bears can look to a possible retreat to the 61.8%/23.6% at 6,650, close to the 200-day SMA.

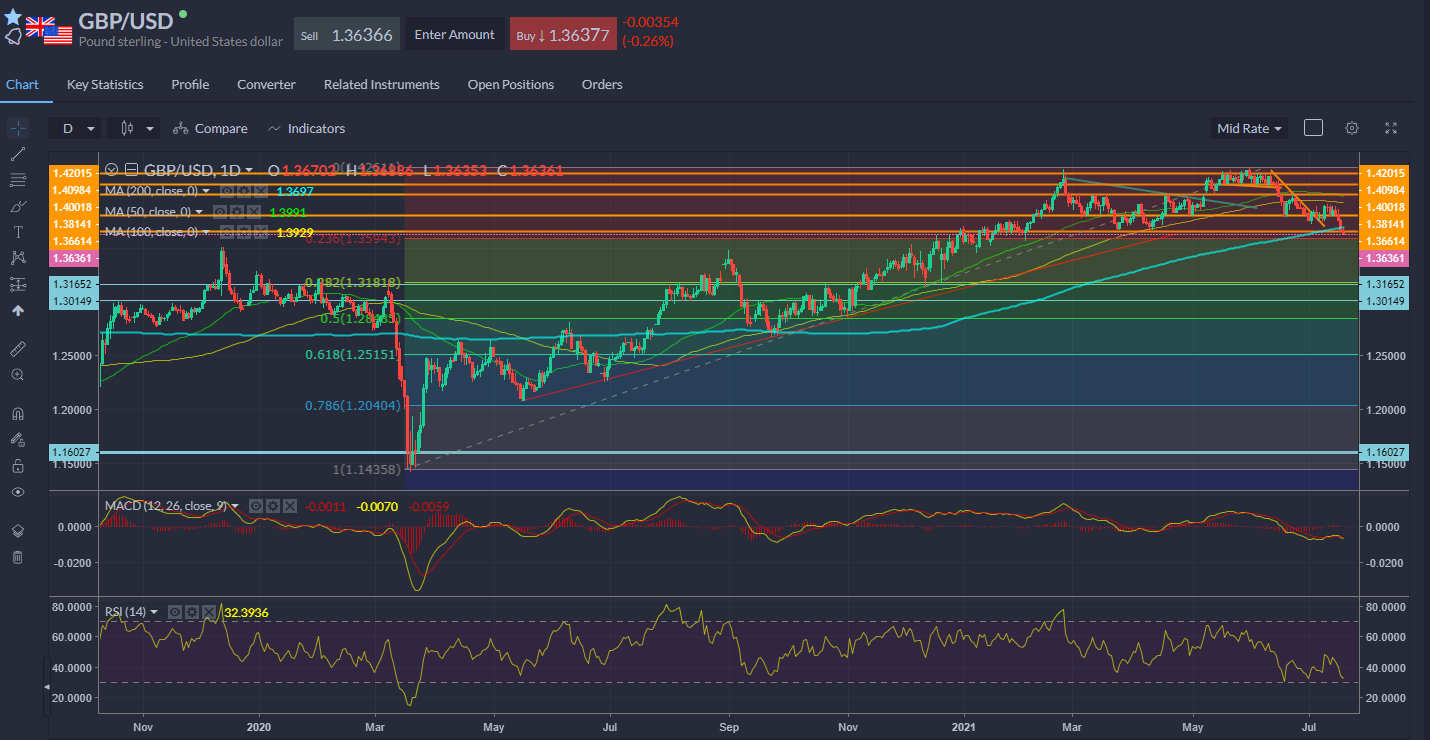
It’s another story of moving averages in FX, with GBP/USD dropping below its 200-day line. It’s not traded under the 100-day and 200-day SMAs since Jun 2020. Not a heap of support below and a swift move back to 1.350 cannot be ruled out.

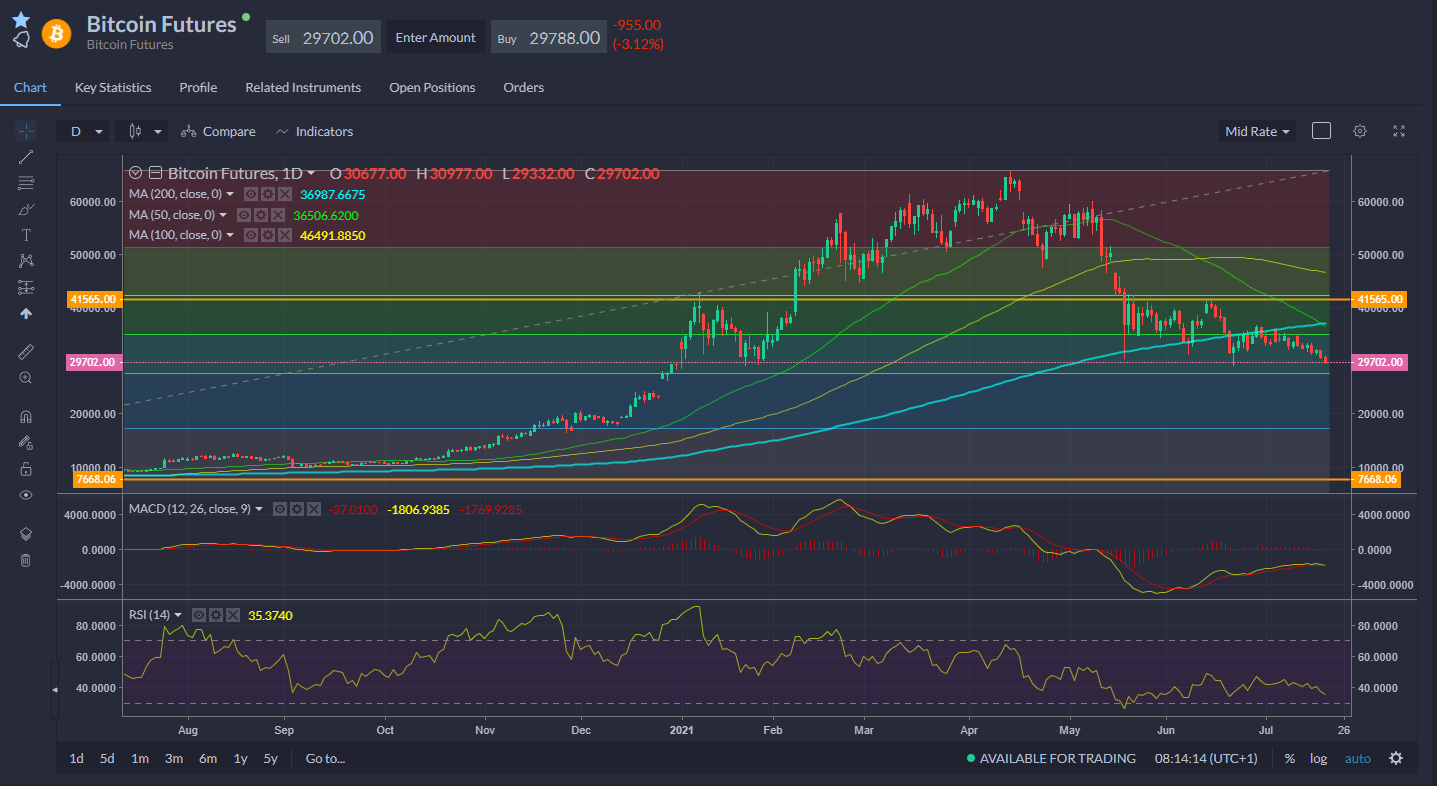
Finally, Bitcoin futures: as I said yesterday the price action was dreadful and shouting out for another leg lower, duly delivered as risk took a beating yesterday (great hedge...). Price action now under $30k and eyeing the Jun low.

