Oil has given up a 0.4 percent boost, even after two positive developments—one for the commodity specifically, the other for risk in general—failed to provide fundamental support for prices.
The president of OPEC, UAE Energy Minister Suhail Al Mazrouei, yesterday denied reports the US asked OPEC to increase oil production in order offset the lack of output from Venezuela and Iran, providing good news for oil traders. The thumbs up for risk assets came this morning when US President Donald Trump and North Korean leader Kim Jong Un signed what appears to be an unprecedented denuclearization agreement.
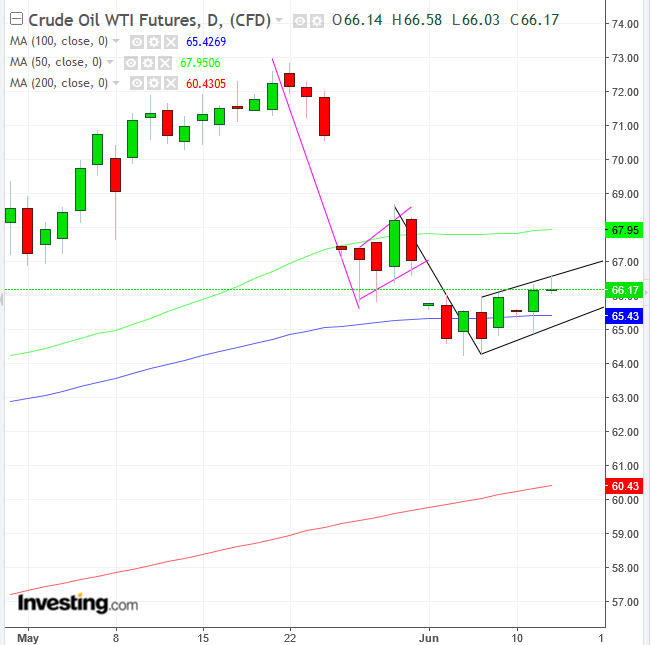
Though oil jumped 0.4 percent, apparently in response to these developments, short-term, bearish aggressive technicians would consider the commodity's inability to hold on to those gains as a test of a top of its trading pattern, a selling opportunity. Barring any other obvious fundamental cause, we agree that was likely the impetus for the selloff.

The price has been traded within a upward biased congestion since it reached a $64.22 low last Tuesday. The rising consolidation followed a sudden, sharp drop from $68.50 since May 31. This pattern provides telltale signs of a bearish rising flag. Incidentally, the described drop was the downside breakout of the same pattern, which started at $72.83 on May 22.
While a downside breakout of the current flag must be executed to complete this pattern, should today’s price close as is, it will have developed a bearish shooting star, reinforcing the negative sentiment, as bulls lost their footing.
Moving averages, as well as other confirming technical gauges, often reveal where the supply-demand pressure points are located on the price chart. Note that the 50 DMA (green) was crossed with the development of the first rising flag and that the 100 DMA will be crossed should the second flag complete, as well.
Might this indicate that the next pause would be the 200 DMA, all the way down by the psychological $60 level? That would indeed be the implied target of the flag.
Trading Strategies – Short Position
Conservative traders would wait for a decisive downside breakout, followed by a return move that confirms the pattern’s resistance, with at least one long, red candle engulfing a preceding red candle or small candle of any color, before committing to a short position.
Moderate traders may wait for the breakout, as well as for a return move, for a better entry, but not necessarily to ascertain the veracity of the pattern.
Aggressive traders may short upon a closing downside breakout; exceptionally aggressive traders may short now, with a stop-loss above today’s high or as far as above $67.00, with a small target at the bottom of the pattern, at around $66.00 or a larger target that would include a downside breakout.
