In light of the scandal-ridden past few years Wells Fargo & Company (NYSE:WFC) has endured, which weighed on the stock and fostered volatility, perhaps the most compelling reason to own shares of the US multinational bank is its 3.23 percent dividend yield, which is significantly higher than what's offered by its peers.
That dividend has provided cover, and compensation for a string of scandals related to the lender's practices: in 2016, "widespread consumer abuses" were brought to light, resulting in the company paying a $185 million settlement. Then, in February of this year, the Fed announced that until "sufficient improvements" were made, the bank would be restricted from growing beyond its total assets as of the end of of 2017.
But now that the 10-year Treasury note is yielding 3.225 (as of this writing), investors looking for reliable fixed income may see the government bond as a much safer bet.
Wells Fargo is currently trading 11.77 percent lower year-to-date. As Friday's Q3 earnings report nears, and with WFC shares currently trading 11.77 lower year-to-date, investors may be asking themselves whether this is the right time to buy—or even sell—WFC shares. In our opinion, earnings have to be dramatically better than expected to overcome the loss of trust both consumers and investors have suffered over the past few years.
But even if Wells Fargo outperforms, investors would be wise to consider another equity with a similar dividend or perhaps a less risky asset—namely the 10-year Treasury. The 10-year is currently a mere 0.75 basis points below Wells Fargo's dividend yield. With such an excellent return, why risk capital on a falling stock when you can receive an equivalent yield with virtually no risk?

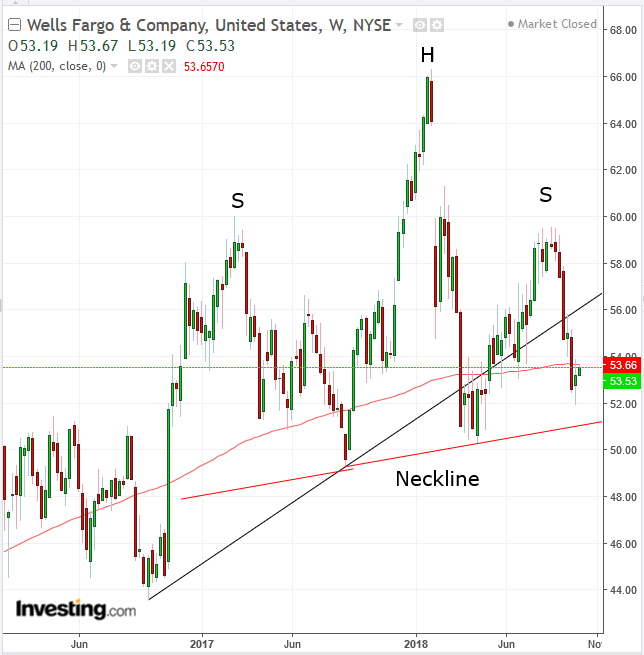
On September 10, the bank's stock price fell below its uptrend line October 2016, for the second time since March 19. Friday, the price crossed below the 200 DMA, which has traced the neckline of a H&S top. A fall below the $50 level would trigger stop-losses and tip the market balance to oversupply.
Trading Strategies – Short Position Setup
Conservative traders should wait for at least a 3 percent penetration and/or three days in which the price was below the neckline, preferably to include a Friday, which demonstrates traders’ commitment to their positions. Then, they may wait for a return move to confirm resistance, with at least one long red candle, engulfing a preceding red or small candle of any color.
Moderate traders may be satisfied with a 2 percent penetration and/or two days with the price below the neckline, to avoid a bear trap. Then, they may wait for a return move, for a better entry, but not necessarily for confirmation of the new trend.
Aggressive traders may enter a short after a 1 percent penetration and/or one day for the price to remain below the neckline.
