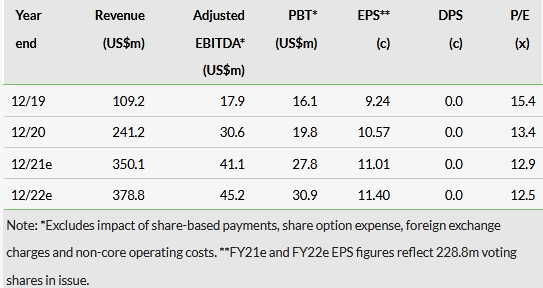
After a strong H121, management expects CentralNic (LON:CNIC) to deliver revenue and profits for the year ‘at least at the upper end of market expectations’. Following its FY20 investment programme, the company delivered 20% y-o-y organic growth in H121 – 16% in Q121 and 25% in Q221, with all business lines contributing. Reflecting continuing strong growth, we have raised our FY21 and FY22 revenue targets to US$350m and US$379m, respectively, while adjusted EBITDA rises slightly to US$41.1m and US$45.2m. On our revised estimates, CentralNic’s shares trade on an undemanding FY21e EV/adjusted EBITDA of 10.0x and P/E of 12.9x, well below its web services and online marketing peers, despite its FY15–20 revenue CAGR of 78% and our estimate for current year growth of 45%.

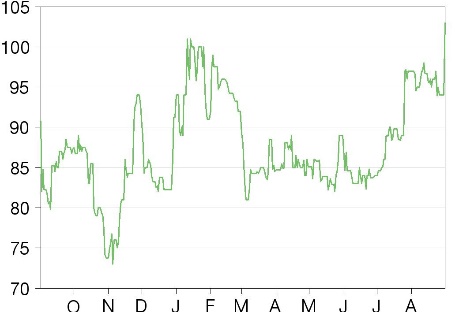
Share price performance

H121 results: Strong top-line growth
H121 gross revenues increased 57% y-o-y to US$174.7m, with net revenues also rising 57% to US$55.2m, a gross margin of 31.6%. Adjusted EBITDA rose 36% to US$20.5m, with margins falling to 11.7% (H120: 13.6%), reflecting the increasing contribution from the lower margin Online Marketing segment. H121 adjusted EPS rose to 5.74 cents (H120: 4.45 cents). Adjusted operating cash conversion was 126%, with net debt falling marginally to US$83.8m at 30 June 2021. As at 30 June 2021, the group’s gross debt totalled US$123.3m, with cash of US$39.5m.
FY21/22 estimates revised upwards, FY23 introduced
We have increased our FY21 revenue estimate by c 8% to US$350m. Assuming higher sustainable organic growth of 8%, we have raised FY22e and FY23e revenue estimates to US$379m and US$409m, respectively. Gross margins rise from 32% in FY21e to 33% in FY22e and FY23e. Our FY21e adjusted EBITDA rises from US$39.5m to US$41.1m, at the top end of current consensus, with FY21e margins in line with H121 at 11.7%. We assume adjusted EBITDA of US$45.2m for FY22e and US$48.8m for FY23e, with a slight rise in margins to 11.9% for both years, benefiting from the anticipated operating leverage.
Valuation: Market-leading growth, marked discount
Whether we compare it to web services or online marketing, CentralNic continues to trade at a material discount to comparators. The web services peer group trades at P/Es of 26x for FY21 and 20x for FY22. We estimate that CentralNic will deliver 45% sales growth in FY21, meaning it offers among the strongest growth in the group and yet trades on an FY21 P/E multiple of 12.9x and an FY22 P/E multiple of 12.5x. CentralNic’s discount to the online marketing peers is even more marked.
H121 interim results
Strong top-line growth, margins lower on business mix
CentralNic continued to trade strongly in H121 and, as a result, management expects to deliver revenue and profits for the year ‘at least at the upper end of market expectations’.
H121 gross revenues increased 57% y-o-y to US$174.7m (H120: US$111.3m), with net revenues also rising 57% to US$55.2m (H120: US$35.2m), a gross margin of 31.6%, which is flat year-on-year (H120: 31.6%). Adjusted EBITDA rose 36% to US$20.5m (H120: US$15.1m), with margins falling to 11.7% (H120: 13.6%), reflecting the increasing contribution from the lower-margin Online Marketing segment, which makes up 55% of gross revenues and 47% of net revenues. H121 adjusted EPS rose to 5.74 cents (H120: 4.45 cents).
In terms of reconciliation between H121 adjusted EBITDA (US$20.5m) and operating income (US$4.7m), the principal elements were: US$1.7m of depreciation (H120: US$1.0m); US$8.3m amortisation of intangible assets (H120: US$5.4m); US$5.1m of non-core operating expenses (H120: US$2.8m), primarily related to M&A and the bond tap issue; a US$1.0m foreign exchange gain on the outstanding bond (H120: loss of US$0.4m); and US$1.7m of share-based payment expenses (H120: US$2.7m) related to acquisitions. This resulted in CentralNic reporting an H121 loss after tax of US$1.5m (H120: a loss of US$3.1m).
Adjusted operating cash conversion was 126%, with net debt falling marginally to US$83.8m at 30 June 2021, from US$85.0m as at 31 December 2020 (31 March 2021: US$79.0m), despite the two acquisitions of SafeBrands and Wando in H121 for US$11.1m, together with the settlement of the final US$1.7m tranche of deferred consideration for Team Internet. The group completed a €15m bond tap issue in February 2021 at 104.5% of nominal value, taking the total outstanding bond value to €105m (of which €80m is hedged against the dollar). As at 30 June 2021, the group’s debt totalled US$123.3m, with cash of US$39.5m.
FY20 investment helps to deliver 20% H121 organic growth
CentralNic has highlighted that it continued to trade strongly, both during lockdown and afterwards throughout H121. Benefiting from its FY20 investment programme, the company delivered 9% y-o-y organic growth in FY20, 16% in Q121 and 25% organic growth in Q221, with all business lines contributing. Management reported 20% y-o-y organic revenue growth for H121.
FY20 investment included streamlining group operations, unifying the group IT infrastructure and central corporate services, investment in people, as well as streamlining the internal supply chain. The company rolled out software tools (eg G-suite, Salesforce, Jira, Confluence, HiBob, Zendesk and Tableau) and invested in CentralNic’s shared functions, building out the teams in new products, finance, people, development and integrations, and a single procurement function for domains and other microservices.
Staff costs have been elevated in H121 following three acquisitions completed since 30 June 2020, together with new hires recruited to accelerate organic growth. Growth in staff has slowed as CentralNic’s team approaches its optimal size.
Segmental analysis: Online Presence, Online Marketing
CentralNic is combining the Direct and Indirect segments (domain name sales and value-added services) and will be reporting on this new segment, Online Presence, alongside Online Marketing in the future.
■ Online Presence: growth in domain name sales accelerated, but value-added services performed even more strongly. The Indirect segment reported organic growth of 12% in H121, as revenues increased 25% y-o-y to US$51.3m (H120: US$41.2m), with net revenues of US$16.3m and a gross margin of 32%. Growth benefited from increased scale, led by key Wholesale brands notably in North America. In the Direct segment, both Retail and the Enterprise businesses continued to grow, with 10% organic growth leading to gross revenues rising 25% y-o-y to US$27.0m (H120: US$21.6m) with net revenues of US$12.8m, gross margins of 47%. The segment was also lifted by the acquisition of SafeBrands in January 2021.
Click on the PDF below to read the full report:
