Breaking News
Investing Pro 0
🚨 NDVA surged 43%. This AI Chipmaker Could Be Next See Analysis

Can The OPEC Production Cut Deal Save Big Oil Dividends?

By Investing.com (Haris Anwar/Investing.com)Stock MarketsApr 14, 2020 08:02
uk.investing.com/analysis/can-the-opec-production-cut-deal-save-big-oil-dividends-200440413
Can The OPEC Production Cut Deal Save Big Oil Dividends?
By Investing.com (Haris Anwar/Investing.com)   |  Apr 14, 2020 08:02
Saved. See Saved Items.
This article has already been saved in your Saved Items
 
 
CVX
+0.03%
Add to/Remove from a Portfolio
Add to Watchlist
Add Position

Position added successfully to:

Please name your holdings portfolio
 
XOM
-0.21%
Add to/Remove from a Portfolio
Add to Watchlist
Add Position

Position added successfully to:

Please name your holdings portfolio
 
CL
+0.99%
Add to/Remove from a Portfolio
Add to Watchlist
Add Position

Position added successfully to:

Please name your holdings portfolio
 
SHEL
-0.82%
Add to/Remove from a Portfolio
Add to Watchlist
Add Position

Position added successfully to:

Please name your holdings portfolio
 
BP
-0.84%
Add to/Remove from a Portfolio
Add to Watchlist
Add Position

Position added successfully to:

Please name your holdings portfolio
 
TTE
-0.37%
Add to/Remove from a Portfolio
Add to Watchlist
Add Position

Position added successfully to:

Please name your holdings portfolio
 

This weekend's historic deal among the major oil-producing nations to introduce the largest-ever cut in their combined output, has raised hopes that oil prices could potentially recover this year saving the U.S.'s largest oil and gas companies, which have all been suffering as prices for those commodities collapsed, from taking increasingly painful actions to protect revenues, such as slashing their dividends.

The agreement was brokered by the U.S. after the sharp drop in global fuel consumption caused by the coronavirus pandemic, which was exacerbated by a feud between the world’s largest producers — Saudi Arabia and Russia — that has threatened the financial viability of North American producers.

West Texas Intermediate, the main U.S. price benchmark, ended Thursday at $22.76 a barrel, down 63% since the start of the year. It’s been even worse in Midland, Texas, where a lot of oil extracted from the Permian Basin is priced, and in western Canada, from which most of the country’s output comes. Oil has traded below $10 a barrel in both markets. After dropping 3.5% yesterday to $22.41, at the time of writing, WTI is up just under 1%, trading at $22.59. 
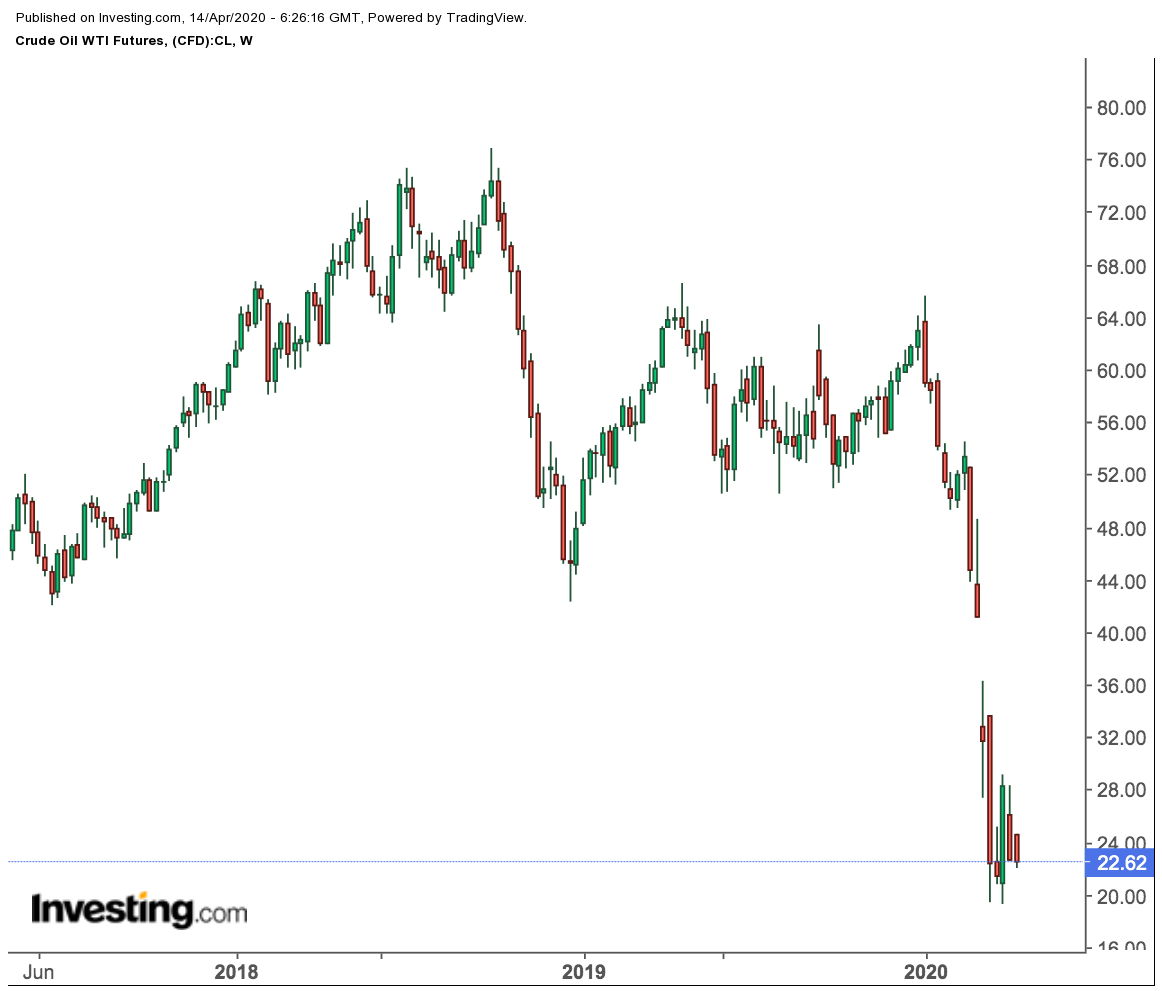
WTI Futures Weekly Chart

For investors in the region’s largest producers, the next big question is whether this deal will help safeguard the payouts they receive from such mega-producers as Exxon Mobil (NYSE:XOM), Chevron (NYSE:NYSE:CVX) and Royal Dutch Shell (NYSE:RDSa).

The world’s biggest oil and gas firms have avoided slashing their dividends for years, to incentivize investors as the appeal of oil stocks continues to diminish along with the shift to cleaner sources of energy. The top five so-called oil majors have added a combined $25 billion to debt levels in 2019 to maintain capital spending, while giving back billions to shareholders.

According to a CNBC.com report, the combined debt of Chevron, Total (NYSE:TOT), BP (NYSE:BP), Exxon Mobil, and Royal Dutch Shell stood at $231 billion in 2019, just shy of the $235 billion hit in 2016 when oil prices also tumbled below $30 a barrel.
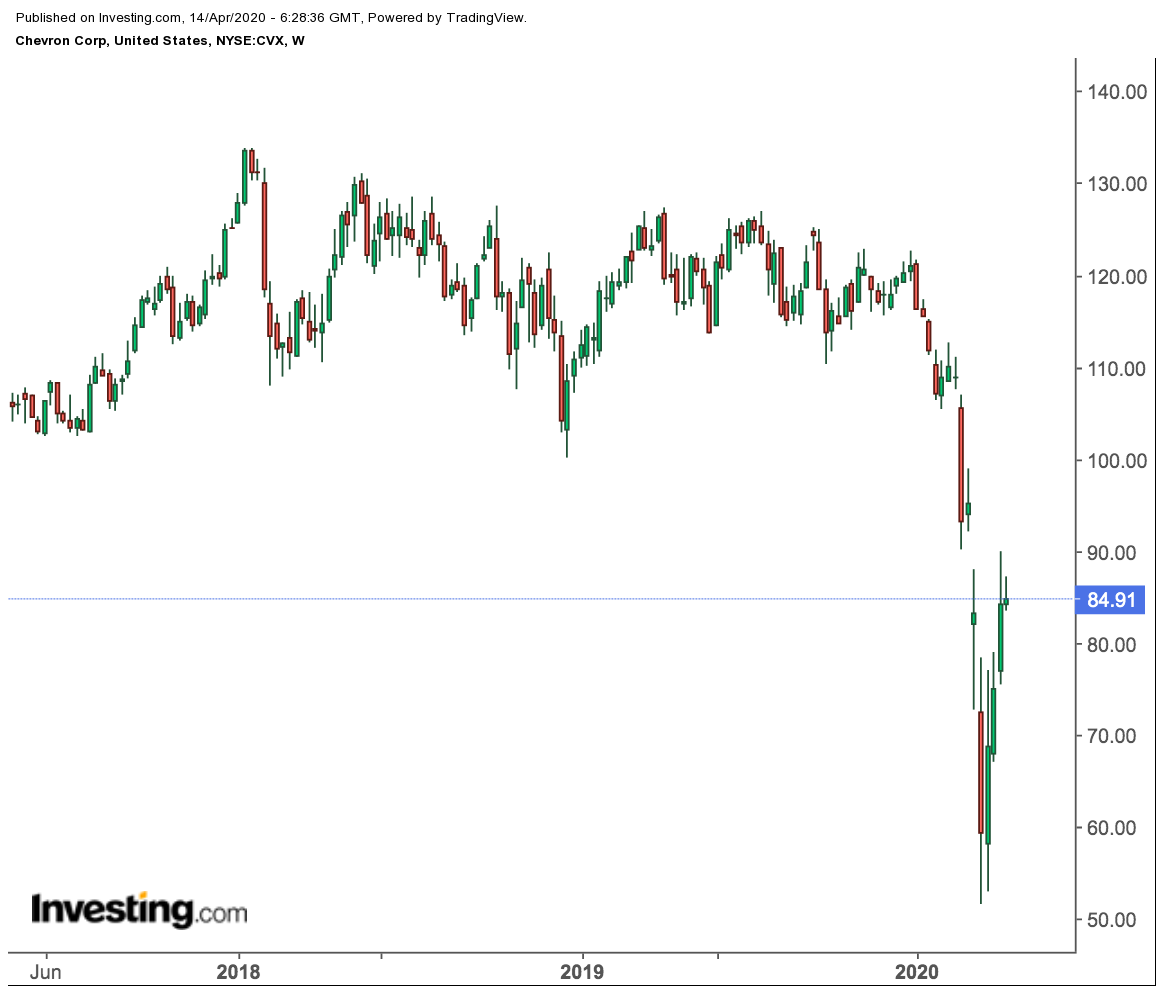
Chevron Weekly Price Chart

The dividend yields from oil companies, a reflection of the risk investors are willing to take in order to own their shares, have also soared after the recent collapse in their stock prices. Exxon Mobil, which has plummeted 39% this year, and Chevron, down 29%, are now yielding 8% and 6% respectively. Exxon closed yesterday's session down 0.4% at $42.76, while Chevron ended Monday up 0.7% at $84.91.

A Glimmer of Hope

While the yield on oil stocks is already showing an extreme level of financial distress, the OPEC+ output deal offers a glimmer of hope as it could provide a floor to plunging prices and provide these producers some breathing space.

Some analysts believe that though production cuts will do little in the short-run to turn the tide of massive oversupply, prices should recover by the end of this year to the mid-$40s.

“It’s simply too late to prevent a super-large inventory build of over one billion barrels between mid-March and late May and to stop spot prices from falling into single digits,” Ed Morse, Citi’s global head of commodities, wrote in a note to clients on Sunday.

Still, big oil companies have endured numerous downturns and even survived the financial crisis of 2008.

“In past oil downturns, Big Oil on aggregate did not respond to challenging macro conditions through material dividend cuts,” analysts at Goldman Sachs said in a recent note, adding that they do not expect a cut because of the current environment.
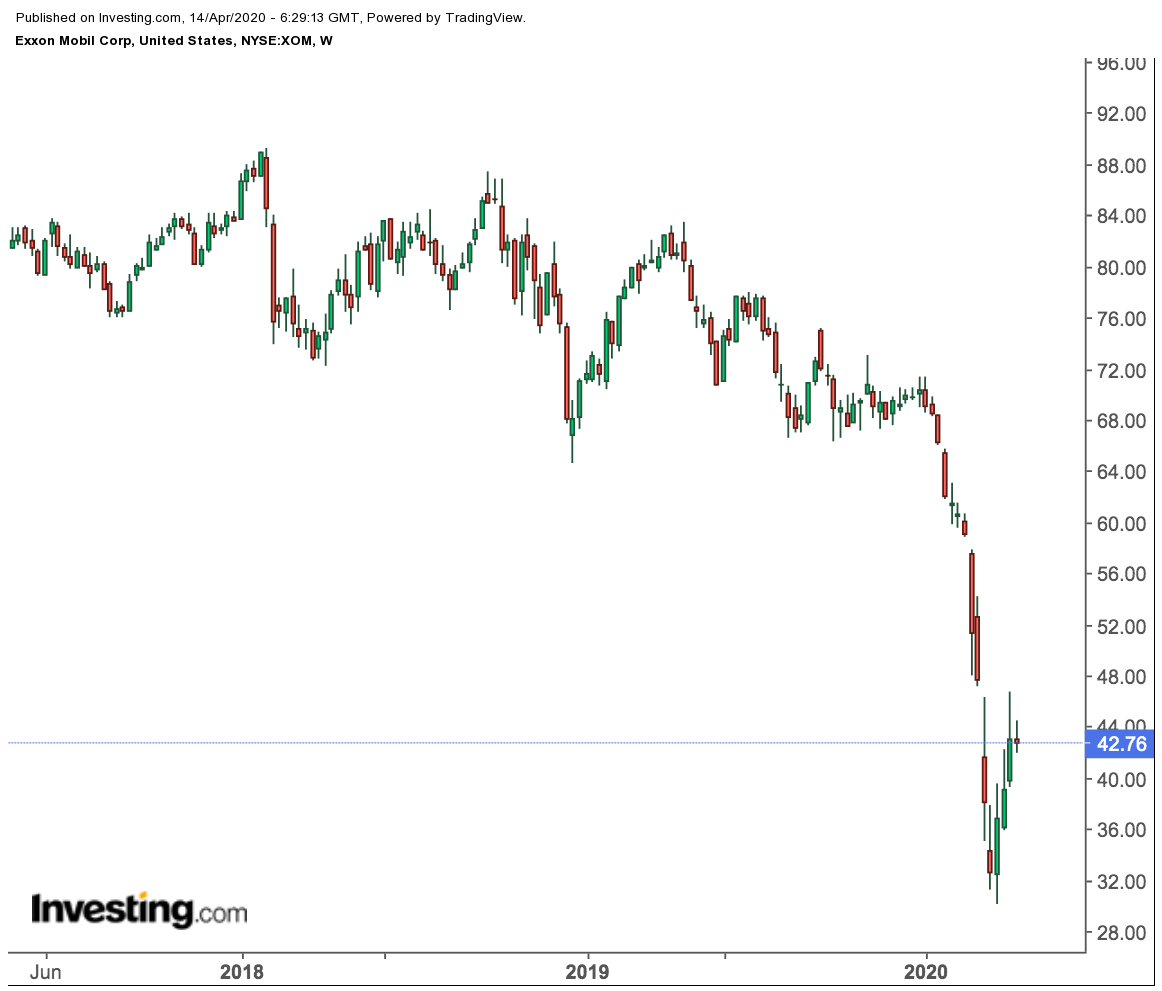
Exxon Weekly Price Chart

Exxon Mobil CEO Darren Woods said at the company's investor day on March 5 that Exxon is “committed to a reliable and growing dividend.” The company has increased its payout each year for the past 37 years.

Chevron’s CEO Mike Wirth also reiterated recently that the integrated energy producer is on track to raise its annual, per-share payout for the 33rd time in 2020. Both Exxon and Chevron stocks have gained more than 10% in the past month.

Bottom Line

No one can say for sure how the oil markets will behave in the coming weeks and months when there is so wide a gap between supply and demand. But the output cuts and the end of Saudi-Russian price war offer some hope that the biggest U.S. oil companies now have more room to deal with the demand shock presented by the coronavirus pandemic.

Can The OPEC Production Cut Deal Save Big Oil Dividends?
 

Related Articles

Can The OPEC Production Cut Deal Save Big Oil Dividends?

Add a Comment

Comment Guidelines

We encourage you to use comments to engage with users, share your perspective and ask questions of authors and each other. However, in order to maintain the high level of discourse we’ve all come to value and expect, please keep the following criteria in mind: 

  • Enrich the conversation
  • Stay focused and on track. Only post material that’s relevant to the topic being discussed.
  • Be respectful. Even negative opinions can be framed positively and diplomatically.
  •  Use standard writing style. Include punctuation and upper and lower cases.
  • NOTE: Spam and/or promotional messages and links within a comment will be removed
  • Avoid profanity, slander or personal attacks directed at an author or another user.
  • Don’t Monopolize the Conversation. We appreciate passion and conviction, but we also believe strongly in giving everyone a chance to air their thoughts. Therefore, in addition to civil interaction, we expect commenters to offer their opinions succinctly and thoughtfully, but not so repeatedly that others are annoyed or offended. If we receive complaints about individuals who take over a thread or forum, we reserve the right to ban them from the site, without recourse.
  • Only English comments will be allowed.

Perpetrators of spam or abuse will be deleted from the site and prohibited from future registration at Investing.com’s discretion.

Write your thoughts here
 
Are you sure you want to delete this chart?
 
Post
Post also to:
 
Replace the attached chart with a new chart ?
1000
Your ability to comment is currently suspended due to negative user reports. Your status will be reviewed by our moderators.
Please wait a minute before you try to comment again.
Thanks for your comment. Please note that all comments are pending until approved by our moderators. It may therefore take some time before it appears on our website.
Comments (1)
Arno Pfohl
Arno Pfohl Apr 14, 2020 17:18
Saved. See Saved Items.
This comment has already been saved in your Saved Items
oil no longer free market. this exemplified that the fundemental rule of demand vs supply is crippled.
 
Are you sure you want to delete this chart?
 
Post
 
Replace the attached chart with a new chart ?
1000
Your ability to comment is currently suspended due to negative user reports. Your status will be reviewed by our moderators.
Please wait a minute before you try to comment again.
Add Chart to Comment
Confirm Block

Are you sure you want to block %USER_NAME%?

By doing so, you and %USER_NAME% will not be able to see any of each other's Investing.com's posts.

%USER_NAME% was successfully added to your Block List

Since you’ve just unblocked this person, you must wait 48 hours before renewing the block.

Report this comment

I feel that this comment is:

Comment flagged

Thank You!

Your report has been sent to our moderators for review
Continue with Google
or
Sign up with Email